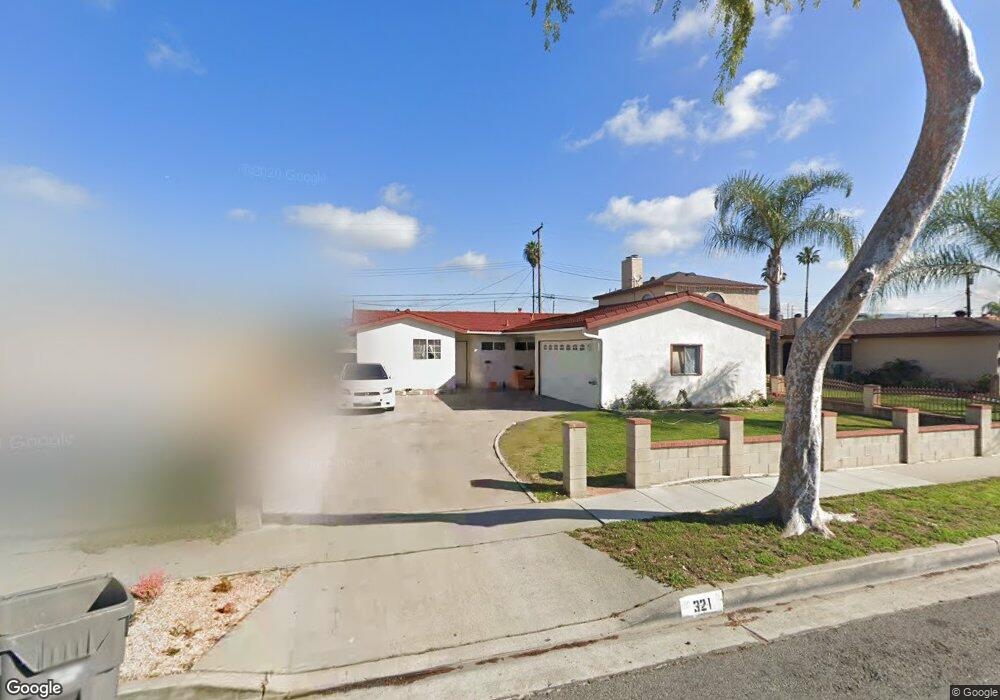
321 E Rosecrest Ave La Habra, CA 90631
Estimated Value: $755,000 - $847,000
3
Beds
2
Baths
1,294
Sq Ft
$619/Sq Ft
Est. Value
About This Home
This home is located at 321 E Rosecrest Ave, La Habra, CA 90631 and is currently estimated at $800,586, approximately $618 per square foot. 321 E Rosecrest Ave is a home located in Orange County with nearby schools including Las Lomas Elementary School, Imperial Middle School, and Sonora High School.
Create a Home Valuation Report for This Property
The Home Valuation Report is an in-depth analysis detailing your home's value as well as a comparison with similar homes in the area
Home Values in the Area
Average Home Value in this Area
Tax History Compared to Growth
Tax History
| Year | Tax Paid | Tax Assessment Tax Assessment Total Assessment is a certain percentage of the fair market value that is determined by local assessors to be the total taxable value of land and additions on the property. | Land | Improvement |
|---|---|---|---|---|
| 2025 | $3,125 | $256,569 | $178,634 | $77,935 |
| 2024 | $3,125 | $251,539 | $175,132 | $76,407 |
| 2023 | $3,051 | $246,607 | $171,698 | $74,909 |
| 2022 | $3,016 | $241,772 | $168,331 | $73,441 |
| 2021 | $2,968 | $237,032 | $165,031 | $72,001 |
| 2020 | $2,940 | $234,602 | $163,339 | $71,263 |
| 2019 | $2,863 | $230,002 | $160,136 | $69,866 |
| 2018 | $2,816 | $225,493 | $156,996 | $68,497 |
| 2017 | $2,767 | $221,072 | $153,918 | $67,154 |
| 2016 | $2,703 | $216,738 | $150,900 | $65,838 |
| 2015 | $2,628 | $213,483 | $148,633 | $64,850 |
| 2014 | $2,552 | $209,302 | $145,722 | $63,580 |
Source: Public Records
Map
Nearby Homes
- 621 S Olive Ave
- 601 S Euclid St Unit 4
- 211 W Mountain View Ave
- 208 W Olive Ave Unit B
- 401 Buena Vista Ave
- 303 S Cadiz Ct
- 405 W Mountain View Ave
- 405 W Mountain View Ave Unit 13
- 300 Vista Dr Unit 94
- 418 W Olive Ave
- 414 W Olive Ave
- 570 E 2nd Ave
- 1230 Lynwood St
- 630 W Lambert Rd Unit 24
- 708 W Lambert Rd Unit 6
- 1001 W Lambert Rd Unit 127
- 1001 W Lambert Rd Unit 116
- 1001 W Lambert Rd Unit 20
- 1001 W Lambert Rd Unit 284
- 1001 W Lambert Rd Unit 87
- 331 E Rosecrest Ave
- 311 E Rosecrest Ave
- 320 Penmar Ave
- 341 E Rosecrest Ave
- 301 E Rosecrest Ave
- 310 Penmar Ave
- 330 Penmar Ave
- 340 Penmar Ave
- 300 Penmar Ave
- 320 E Rosecrest Ave
- 271 E Rosecrest Ave
- 351 E Rosecrest Ave
- 330 E Rosecrest Ave
- 310 E Rosecrest Ave
- 340 E Rosecrest Ave
- 270 Penmar Ave
- 350 Penmar Ave
- 300 E Rosecrest Ave
- 261 E Rosecrest Ave
- 361 E Rosecrest Ave