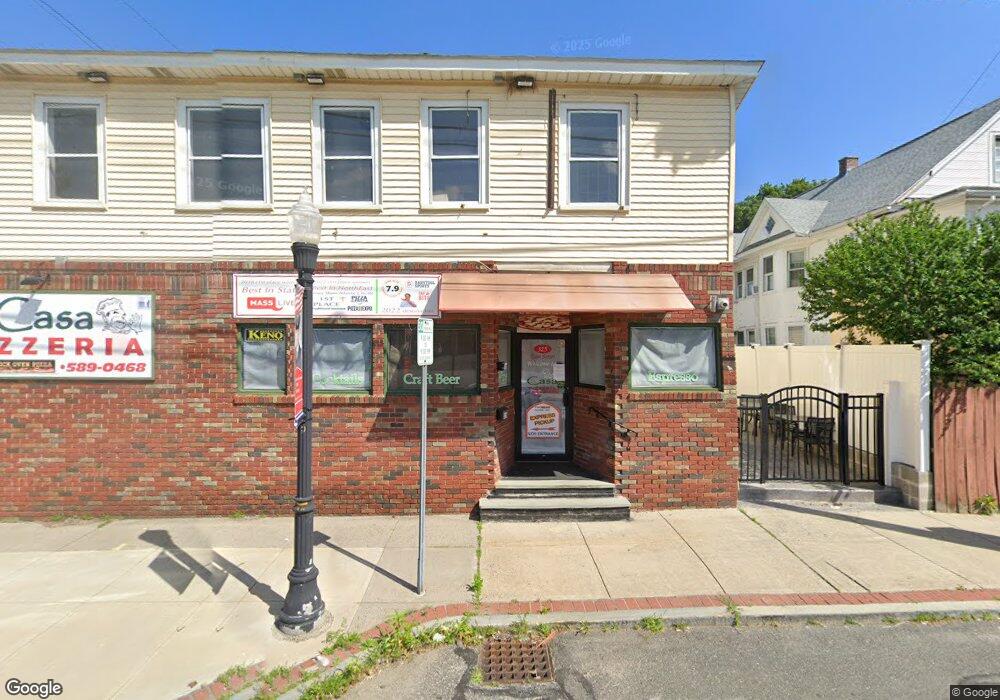
321 East St Unit 325 Ludlow, MA 01056
Estimated Value: $253,982
--
Bed
--
Bath
4,638
Sq Ft
$55/Sq Ft
Est. Value
About This Home
This home is located at 321 East St Unit 325, Ludlow, MA 01056 and is currently priced at $253,982, approximately $54 per square foot. 321 East St Unit 325 is a home located in Hampden County with nearby schools including East Street Elementary School, Chapin Street Elementary School, and Paul R. Baird Middle School.
Ownership History
Date
Name
Owned For
Owner Type
Purchase Details
Closed on
Sep 27, 2024
Sold by
Carvalho James R
Bought by
East Street Invs Llc
Current Estimated Value
Home Financials for this Owner
Home Financials are based on the most recent Mortgage that was taken out on this home.
Original Mortgage
$410,000
Outstanding Balance
$405,012
Interest Rate
6.49%
Mortgage Type
New Conventional
Purchase Details
Closed on
Oct 31, 2003
Sold by
Alessandrini Anna M and Alessandrini Clairo
Bought by
Carvalho James R
Create a Home Valuation Report for This Property
The Home Valuation Report is an in-depth analysis detailing your home's value as well as a comparison with similar homes in the area
Home Values in the Area
Average Home Value in this Area
Purchase History
| Date | Buyer | Sale Price | Title Company |
|---|---|---|---|
| East Street Invs Llc | -- | None Available | |
| East Street Invs Llc | -- | None Available | |
| East Street Invs Llc | -- | None Available | |
| Carvalho James R | $117,000 | -- | |
| Carvalho James R | $117,000 | -- | |
| Carvalho James R | $117,000 | -- |
Source: Public Records
Mortgage History
| Date | Status | Borrower | Loan Amount |
|---|---|---|---|
| Open | East Street Invs Llc | $410,000 | |
| Closed | East Street Invs Llc | $410,000 | |
| Previous Owner | Carvalho James R | $128,000 |
Source: Public Records
Tax History Compared to Growth
Tax History
| Year | Tax Paid | Tax Assessment Tax Assessment Total Assessment is a certain percentage of the fair market value that is determined by local assessors to be the total taxable value of land and additions on the property. | Land | Improvement |
|---|---|---|---|---|
| 2025 | $4,940 | $284,700 | $129,700 | $155,000 |
| 2024 | $4,955 | $273,900 | $118,900 | $155,000 |
| 2023 | $4,926 | $252,500 | $108,100 | $144,400 |
| 2022 | $5,029 | $251,600 | $108,100 | $143,500 |
| 2021 | $5,217 | $247,500 | $104,900 | $142,600 |
| 2020 | $5,091 | $246,900 | $103,400 | $143,500 |
| 2019 | $4,814 | $242,900 | $100,400 | $142,500 |
| 2018 | $4,572 | $240,500 | $100,400 | $140,100 |
| 2017 | $4,382 | $236,500 | $97,500 | $139,000 |
| 2016 | $4,257 | $234,800 | $95,500 | $139,300 |
| 2015 | $4,046 | $234,000 | $94,600 | $139,400 |
Source: Public Records
Map
Nearby Homes
- 287 East St
- 41 Orchard St
- 32 Berkshire St
- 37 Franklin St
- 415 Winsor St
- 45 Meadow St
- 24 Elm St
- 87 Haviland St
- 148 Yale St
- 0 Center St Unit 73415933
- 32 White St
- 142 Amherst St
- 13 - 13.5 Weston St
- 89-91 Stony Hill Rd
- 0 Parker St (Ws) Unit 73388310
- 24 Dumaine St
- 0 Fuller St Unit 73409741
- 51 Parkview St
- 70 Fuller St
- 84 Fuller St Unit 1
- 325 East St
- 323 East St
- 329 East St Unit 331
- 329-331 East St
- 12 Prospect St Unit 14
- 1214 Prospect St
- 313 East St Unit 319
- 335 East St Unit 335
- 315 East St Unit 2
- 315 East St Unit 1
- 315 East St Unit 3
- 339 East St
- 11 Prospect St Unit 13
- 341 East St
- 341 East St Unit 1
- 309 East St
- 24 Prospect St Unit 26
- 334-336 East St
- 334 East St Unit 336
- 17 Prospect St