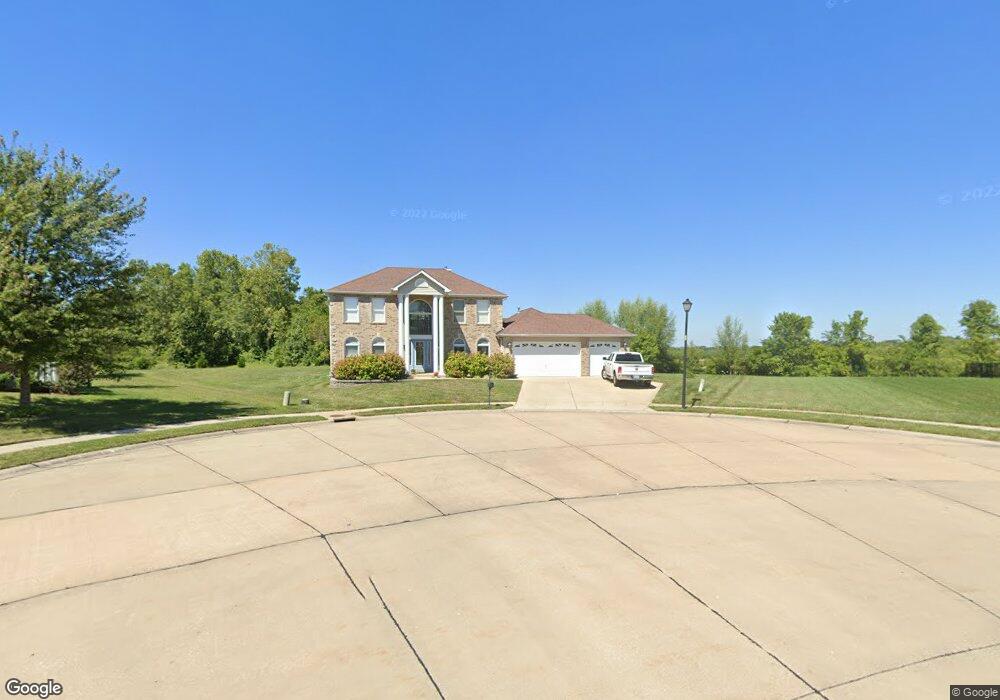
321 Edbrooke Dr Belleville, IL 62221
Estimated Value: $343,000 - $437,109
4
Beds
4
Baths
2,875
Sq Ft
$137/Sq Ft
Est. Value
About This Home
This home is located at 321 Edbrooke Dr, Belleville, IL 62221 and is currently estimated at $393,777, approximately $136 per square foot. 321 Edbrooke Dr is a home located in St. Clair County with nearby schools including Shiloh Elementary School, Shiloh Middle School, and O'Fallon Township High School.
Ownership History
Date
Name
Owned For
Owner Type
Purchase Details
Closed on
Sep 3, 2013
Sold by
The Secretary Of Veterans Affairs
Bought by
Winkelmann Seth A
Current Estimated Value
Home Financials for this Owner
Home Financials are based on the most recent Mortgage that was taken out on this home.
Original Mortgage
$148,500
Outstanding Balance
$108,450
Interest Rate
3.87%
Mortgage Type
New Conventional
Estimated Equity
$285,327
Purchase Details
Closed on
Aug 21, 2012
Sold by
Lee John E
Bought by
Government National Mortgage Association
Purchase Details
Closed on
Jun 30, 2006
Sold by
Whitaker Builders Inc
Bought by
Lee John E and Lee Maryann E
Home Financials for this Owner
Home Financials are based on the most recent Mortgage that was taken out on this home.
Original Mortgage
$339,805
Interest Rate
6.73%
Mortgage Type
VA
Create a Home Valuation Report for This Property
The Home Valuation Report is an in-depth analysis detailing your home's value as well as a comparison with similar homes in the area
Home Values in the Area
Average Home Value in this Area
Purchase History
| Date | Buyer | Sale Price | Title Company |
|---|---|---|---|
| Winkelmann Seth A | $165,000 | Community Title Shiloh Llc | |
| Government National Mortgage Association | -- | None Available | |
| Lee John E | $329,500 | Benchmark Title Company |
Source: Public Records
Mortgage History
| Date | Status | Borrower | Loan Amount |
|---|---|---|---|
| Open | Winkelmann Seth A | $148,500 | |
| Previous Owner | Lee John E | $339,805 |
Source: Public Records
Tax History Compared to Growth
Tax History
| Year | Tax Paid | Tax Assessment Tax Assessment Total Assessment is a certain percentage of the fair market value that is determined by local assessors to be the total taxable value of land and additions on the property. | Land | Improvement |
|---|---|---|---|---|
| 2024 | $8,208 | $116,708 | $25,032 | $91,676 |
| 2023 | $7,748 | $108,153 | $24,296 | $83,857 |
| 2022 | $7,408 | $100,738 | $22,630 | $78,108 |
| 2021 | $6,894 | $94,732 | $21,281 | $73,451 |
| 2020 | $7,102 | $89,408 | $20,085 | $69,323 |
| 2019 | $6,801 | $87,503 | $20,864 | $66,639 |
| 2018 | $6,670 | $85,004 | $20,268 | $64,736 |
| 2017 | $6,454 | $81,013 | $19,316 | $61,697 |
| 2016 | $6,402 | $79,471 | $18,948 | $60,523 |
| 2014 | $6,020 | $81,018 | $19,651 | $61,367 |
| 2013 | $8,767 | $82,110 | $19,916 | $62,194 |
Source: Public Records
Map
Nearby Homes
- 3533 Capri Ln
- 3700 Osprey Ct
- 845 Mohave Ct
- 3424 Navajo Trail
- 3536 Harbor Way
- 869 Ashley Cove Ct
- 3416 Navajo Trail
- 414 Grand Reserve
- 3716 Osprey Ct
- xxxx Chippewa Dr
- Brady Plan at Indian Springs - Indian Spring
- Winchester B Plan at Indian Springs - Indian Spring
- Alexandria Plan at Indian Springs - Indian Spring
- Hannah Plan at Indian Springs - Indian Spring
- Culpepper Plan at Indian Springs - Indian Spring
- Bristol Villa Plan at Indian Springs - Indian Spring
- Bristol Plan at Indian Springs - Indian Spring
- Covington 2 Car Plan at Indian Springs - Indian Spring
- Winchester A Plan at Indian Springs - Indian Spring
- Sunrise Plan at Indian Springs - Indian Spring
- 325 Edbrooke Dr
- 317 Edbrooke Dr
- 329 Edbrooke Dr
- 313 Edbrooke Dr
- 318 Edbrooke Dr
- 314 Edbrooke Dr
- 3514 Barton Dr
- 309 Edbrooke Dr
- 3510 Barton Dr
- 3520 Barton Dr
- 3506 Barton Dr
- 3504 Golden Spring Pkwy
- 310 Edbrooke Dr
- 3502 Barton Dr
- 3524 Barton Dr
- 3604 Chippewa Dr
- 305 Edbrooke Dr
- 3512 Middlebury Way
- 3608 Chippewa Dr
- 3608 Chippewa Dr