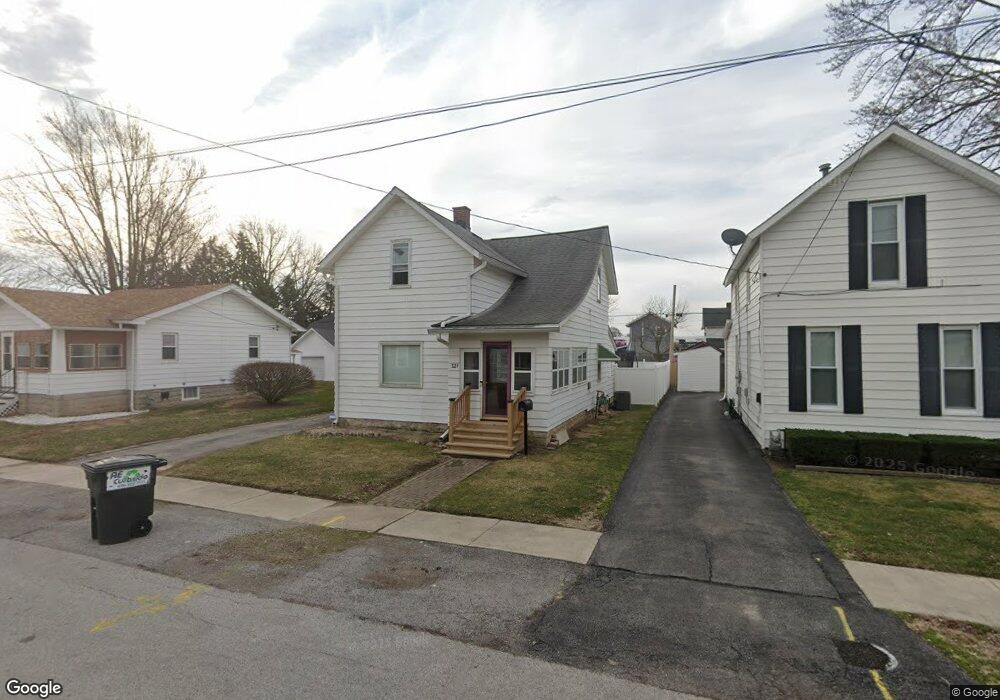
321 Garfield Ave Findlay, OH 45840
Estimated Value: $142,000 - $176,000
3
Beds
1
Bath
1,262
Sq Ft
$124/Sq Ft
Est. Value
About This Home
This home is located at 321 Garfield Ave, Findlay, OH 45840 and is currently estimated at $156,756, approximately $124 per square foot. 321 Garfield Ave is a home located in Hancock County with nearby schools including Whittier Primary School, Bigelow Hill Elementary School, and Glenwood Middle School.
Ownership History
Date
Name
Owned For
Owner Type
Purchase Details
Closed on
Aug 30, 2018
Sold by
Humphrey James
Bought by
Humphrey Christina and Rickard Christina
Current Estimated Value
Purchase Details
Closed on
Apr 8, 2005
Sold by
Ogg Jason L and Ogg Tami M
Bought by
Rickard Christina
Home Financials for this Owner
Home Financials are based on the most recent Mortgage that was taken out on this home.
Original Mortgage
$89,500
Outstanding Balance
$51,561
Interest Rate
7.62%
Mortgage Type
Fannie Mae Freddie Mac
Estimated Equity
$105,195
Purchase Details
Closed on
Mar 13, 1998
Sold by
Est Charles Philipps
Bought by
Ogg Jason and Ogg Tami
Home Financials for this Owner
Home Financials are based on the most recent Mortgage that was taken out on this home.
Original Mortgage
$53,200
Interest Rate
7.23%
Mortgage Type
New Conventional
Create a Home Valuation Report for This Property
The Home Valuation Report is an in-depth analysis detailing your home's value as well as a comparison with similar homes in the area
Home Values in the Area
Average Home Value in this Area
Purchase History
| Date | Buyer | Sale Price | Title Company |
|---|---|---|---|
| Humphrey Christina | -- | Whitman Title Security | |
| Rickard Christina | $89,500 | Golden Key Title Agency | |
| Ogg Jason | $56,000 | -- |
Source: Public Records
Mortgage History
| Date | Status | Borrower | Loan Amount |
|---|---|---|---|
| Open | Rickard Christina | $89,500 | |
| Previous Owner | Ogg Jason | $53,200 |
Source: Public Records
Tax History Compared to Growth
Tax History
| Year | Tax Paid | Tax Assessment Tax Assessment Total Assessment is a certain percentage of the fair market value that is determined by local assessors to be the total taxable value of land and additions on the property. | Land | Improvement |
|---|---|---|---|---|
| 2024 | $1,223 | $34,430 | $2,950 | $31,480 |
| 2023 | $1,225 | $34,430 | $2,950 | $31,480 |
| 2022 | $1,221 | $34,430 | $2,950 | $31,480 |
| 2021 | $1,115 | $27,390 | $2,960 | $24,430 |
| 2020 | $1,115 | $27,390 | $2,960 | $24,430 |
| 2019 | $1,092 | $27,390 | $2,960 | $24,430 |
| 2018 | $969 | $22,300 | $2,690 | $19,610 |
| 2017 | $485 | $22,300 | $2,690 | $19,610 |
| 2016 | $966 | $22,300 | $2,690 | $19,610 |
| 2015 | $691 | $15,790 | $1,470 | $14,320 |
| 2014 | $691 | $15,790 | $1,470 | $14,320 |
| 2012 | $697 | $15,790 | $1,470 | $14,320 |
Source: Public Records
Map
Nearby Homes
- 230 Midland Ave
- 420 Allen Ave
- 206 Midland Ave
- 334 E Foulke Ave
- 115 George St
- 247 Crystal Ave
- 207 Ash Ave
- 715 Christina Ct
- 1010 Brenda Ct
- 716 Winfield Ave
- 706 N Cory St
- 1825 Pershing St
- 1062 Vincent St
- 1820 N Main St
- 224 Defiance Ave
- 1908 Gayle Ln
- 512 N Cory St
- 600 Charles Ave
- 213 Cherry St
- 2100 Candlewick Dr
- 325 Garfield Ave
- 317 Garfield Ave
- 322 George St
- 320 George St
- 328 George St
- 331 Garfield Ave
- 318 George St
- 330 George St
- 315 Garfield Ave
- 322 Garfield Ave
- 318 Garfield Ave
- 318 Garfield Ave
- 324 Garfield Ave
- 316 George St
- 330 Garfield Ave
- 312 Garfield Ave
- 309 Garfield Ave
- 337 Garfield Ave
- 310 312 Garfield Ave
- 310 Garfield Ave