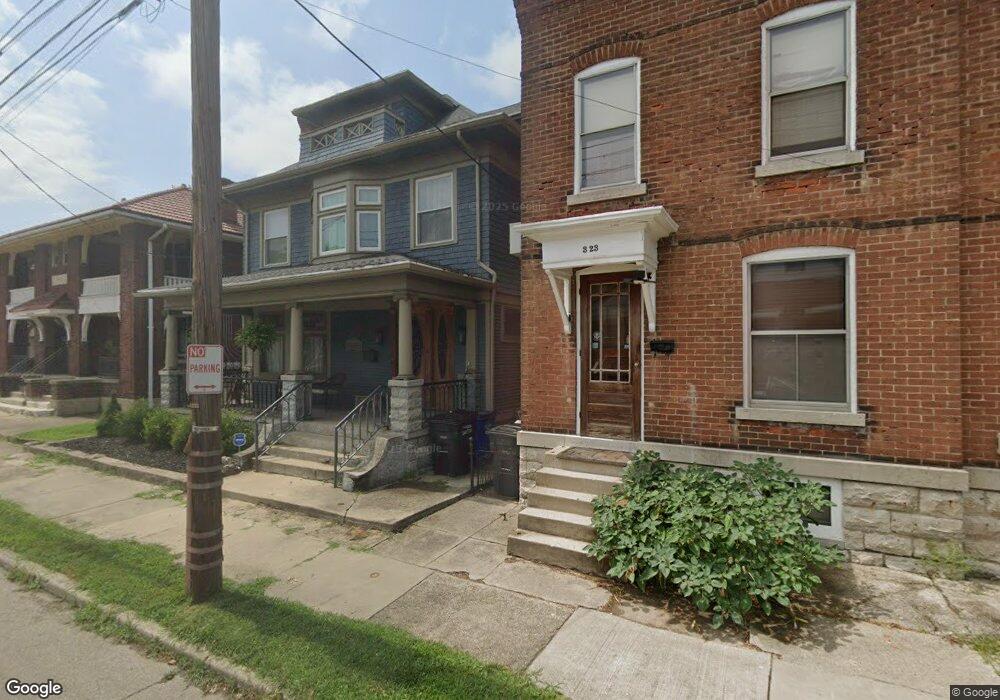
321 Hickory St Dayton, OH 45410
South Park NeighborhoodEstimated Value: $237,000 - $310,882
3
Beds
3
Baths
2,350
Sq Ft
$123/Sq Ft
Est. Value
About This Home
This home is located at 321 Hickory St, Dayton, OH 45410 and is currently estimated at $289,971, approximately $123 per square foot. 321 Hickory St is a home located in Montgomery County with nearby schools including Ruskin Elementary School, Kiser Elementary, and Emerson Academy.
Ownership History
Date
Name
Owned For
Owner Type
Purchase Details
Closed on
Nov 14, 2023
Sold by
Downs Kerby L and Downs Jason B
Bought by
Ostendorf David A
Current Estimated Value
Purchase Details
Closed on
Aug 2, 2017
Sold by
Cassiman Shawn A
Bought by
Downs Kerby L and Alspaugh Jason B
Purchase Details
Closed on
Jun 14, 2007
Sold by
Rish Walter E and Rish Colleen J
Bought by
Cassiman Shawn A
Home Financials for this Owner
Home Financials are based on the most recent Mortgage that was taken out on this home.
Original Mortgage
$152,000
Interest Rate
6.26%
Mortgage Type
Purchase Money Mortgage
Purchase Details
Closed on
Mar 13, 1998
Sold by
Westgerdes Ralph B and Westgerdes Catherine L
Bought by
Rish Colleen J
Home Financials for this Owner
Home Financials are based on the most recent Mortgage that was taken out on this home.
Original Mortgage
$81,000
Interest Rate
7.14%
Create a Home Valuation Report for This Property
The Home Valuation Report is an in-depth analysis detailing your home's value as well as a comparison with similar homes in the area
Home Values in the Area
Average Home Value in this Area
Purchase History
| Date | Buyer | Sale Price | Title Company |
|---|---|---|---|
| Ostendorf David A | -- | None Listed On Document | |
| Downs Kerby L | $77,000 | None Available | |
| Cassiman Shawn A | $152,000 | Attorney | |
| Rish Colleen J | $108,000 | -- | |
| Rish Colleen J | $108,000 | -- |
Source: Public Records
Mortgage History
| Date | Status | Borrower | Loan Amount |
|---|---|---|---|
| Previous Owner | Cassiman Shawn A | $152,000 | |
| Previous Owner | Rish Colleen J | $81,000 |
Source: Public Records
Tax History Compared to Growth
Tax History
| Year | Tax Paid | Tax Assessment Tax Assessment Total Assessment is a certain percentage of the fair market value that is determined by local assessors to be the total taxable value of land and additions on the property. | Land | Improvement |
|---|---|---|---|---|
| 2024 | $5,484 | $101,230 | $11,900 | $89,330 |
| 2023 | $5,484 | $94,510 | $12,190 | $82,320 |
| 2022 | $5,065 | $67,130 | $9,030 | $58,100 |
| 2021 | $3,753 | $49,600 | $9,030 | $40,570 |
| 2020 | $3,745 | $49,600 | $9,030 | $40,570 |
| 2019 | $4,627 | $55,760 | $9,030 | $46,730 |
| 2018 | $4,634 | $55,760 | $9,030 | $46,730 |
| 2017 | $4,481 | $55,760 | $9,030 | $46,730 |
| 2016 | $4,900 | $58,170 | $9,030 | $49,140 |
| 2015 | $4,636 | $58,170 | $9,030 | $49,140 |
| 2014 | $4,636 | $58,170 | $9,030 | $49,140 |
| 2012 | -- | $43,650 | $8,990 | $34,660 |
Source: Public Records
Map
Nearby Homes