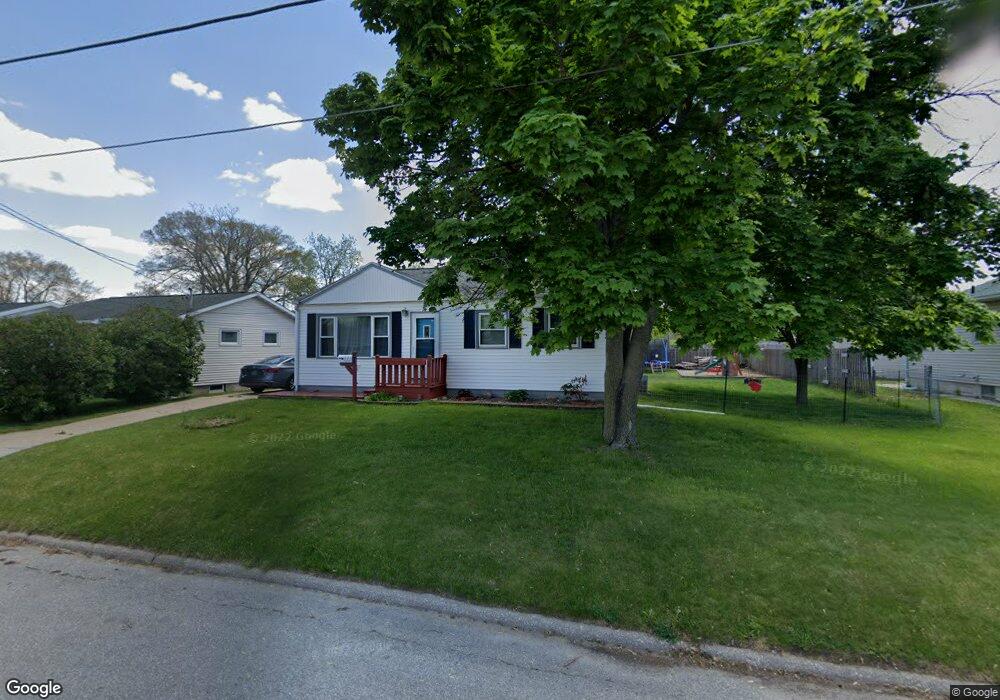
321 Joder Ave Waterloo, IA 50701
Estimated Value: $140,000 - $163,500
3
Beds
2
Baths
1,230
Sq Ft
$125/Sq Ft
Est. Value
About This Home
This home is located at 321 Joder Ave, Waterloo, IA 50701 and is currently estimated at $153,375, approximately $124 per square foot. 321 Joder Ave is a home located in Black Hawk County with nearby schools including Becker Elementary School, Central Middle School, and East High School.
Ownership History
Date
Name
Owned For
Owner Type
Purchase Details
Closed on
Nov 25, 2020
Sold by
Redenbaugh Thomas A and Redenbaugh Jayde E
Bought by
Walton Demarius
Current Estimated Value
Home Financials for this Owner
Home Financials are based on the most recent Mortgage that was taken out on this home.
Original Mortgage
$89,600
Interest Rate
2.8%
Mortgage Type
New Conventional
Purchase Details
Closed on
Dec 19, 2018
Sold by
Kalahiki Kevin J and Kalahiki Supinya
Bought by
Redenbaugh Thomas A
Home Financials for this Owner
Home Financials are based on the most recent Mortgage that was taken out on this home.
Original Mortgage
$95,000
Interest Rate
4.8%
Mortgage Type
New Conventional
Purchase Details
Closed on
Jan 31, 2013
Sold by
Brouwer John L and Brouwer Mary F
Bought by
Kalahiki Kevin J
Home Financials for this Owner
Home Financials are based on the most recent Mortgage that was taken out on this home.
Original Mortgage
$110,832
Interest Rate
3.34%
Mortgage Type
VA
Create a Home Valuation Report for This Property
The Home Valuation Report is an in-depth analysis detailing your home's value as well as a comparison with similar homes in the area
Purchase History
| Date | Buyer | Sale Price | Title Company |
|---|---|---|---|
| Walton Demarius | $112,500 | Title Services | |
| Walton Demarius | $112,000 | Title Services | |
| Walton Demarius | $112,500 | Title Services | |
| Redenbaugh Thomas A | $100,000 | -- | |
| Kalahiki Kevin J | $108,500 | Black Hawk County Abstract & |
Source: Public Records
Mortgage History
| Date | Status | Borrower | Loan Amount |
|---|---|---|---|
| Previous Owner | Walton Demarius | $89,600 | |
| Previous Owner | Redenbaugh Thomas A | $95,000 | |
| Previous Owner | Kalahiki Kevin J | $110,832 |
Source: Public Records
Tax History
| Year | Tax Paid | Tax Assessment Tax Assessment Total Assessment is a certain percentage of the fair market value that is determined by local assessors to be the total taxable value of land and additions on the property. | Land | Improvement |
|---|---|---|---|---|
| 2025 | $2,664 | $159,820 | $25,220 | $134,600 |
| 2024 | $2,664 | $133,050 | $25,220 | $107,830 |
| 2023 | $2,150 | $133,050 | $25,220 | $107,830 |
| 2022 | $2,152 | $106,770 | $25,220 | $81,550 |
| 2021 | $2,264 | $109,620 | $25,220 | $84,400 |
| 2020 | $2,208 | $99,120 | $15,520 | $83,600 |
| 2019 | $2,208 | $99,120 | $15,520 | $83,600 |
| 2018 | $2,210 | $99,120 | $15,520 | $83,600 |
| 2017 | $2,276 | $99,120 | $15,520 | $83,600 |
| 2016 | $2,248 | $99,120 | $15,520 | $83,600 |
| 2015 | $2,248 | $99,120 | $15,520 | $83,600 |
| 2014 | $2,292 | $99,120 | $15,520 | $83,600 |
Source: Public Records
Map
Nearby Homes
- 402 Black Hawk Rd
- 330 Black Hawk Rd
- 422 Hartman Ave
- 2320 University Ave
- 1044 Dundee Ave
- 131 Axlewood Dr
- 124 Axlewood Dr
- 117 Axlewood Dr
- 118 Axlewood Dr
- 610 Reber Ave
- 143 Chicago St
- 2006 W 3rd St
- 826 Home Park Blvd
- 631 Wallgate Ave
- 1221 Downing Ave
- 610 Wallgate Ave
- 608 Wallgate Ave
- 645 Dundee Ave
- 1237 W Mullan Ave
- 1235 W Mullan Ave
- 315 Joder Ave
- 325 Joder Ave
- 329 Joder Ave
- 416 Black Hawk Rd
- 424 Black Hawk Rd
- 412 Black Hawk Rd
- 307 Joder Ave Unit 309
- 303 Joder Ave
- 410 Black Hawk Rd
- 1709 University Ave Unit 3
- 1709 University Ave Unit 5
- 1709 University Ave Unit 6
- 1709 University Ave Unit 4
- 1709 University Ave Unit 2
- 1709 University Ave Unit 1
- 1709 University Ave
- 1339 Knoll Ave
- 1727 University Ave Unit Suite 102
- 1727 University Ave Unit Suite 104
- 1332 Knoll Ave
Your Personal Tour Guide
Ask me questions while you tour the home.