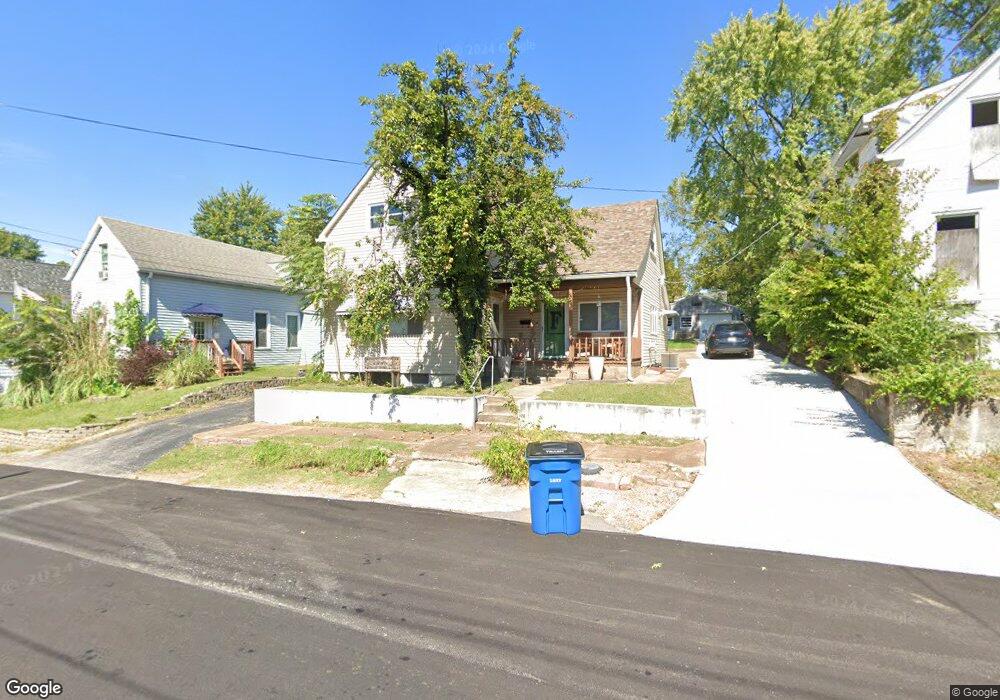
321 Lagro Ave Saint Louis, MO 63125
Lemay NeighborhoodEstimated Value: $155,000 - $190,000
3
Beds
1
Bath
1,306
Sq Ft
$128/Sq Ft
Est. Value
About This Home
This home is located at 321 Lagro Ave, Saint Louis, MO 63125 and is currently estimated at $166,996, approximately $127 per square foot. 321 Lagro Ave is a home located in St. Louis County with nearby schools including Hancock Place Elementary School, Hancock Place Middle School, and Hancock Place High School.
Ownership History
Date
Name
Owned For
Owner Type
Purchase Details
Closed on
Mar 7, 2015
Sold by
Britt Kathryn Ann
Bought by
Britt Kathryn Ann
Current Estimated Value
Purchase Details
Closed on
Dec 7, 2005
Sold by
Parey Jesse J
Bought by
Parey Jesse J and Jesse J Parey Revocable Living Trust
Purchase Details
Closed on
Feb 14, 2000
Sold by
Parey Jesse J and Parey Dorothy T
Bought by
Parey Mike and Martin Marilyn
Create a Home Valuation Report for This Property
The Home Valuation Report is an in-depth analysis detailing your home's value as well as a comparison with similar homes in the area
Home Values in the Area
Average Home Value in this Area
Purchase History
| Date | Buyer | Sale Price | Title Company |
|---|---|---|---|
| Britt Kathryn Ann | -- | None Available | |
| Parey Jesse J | -- | -- | |
| Parey Mike | -- | -- |
Source: Public Records
Tax History
| Year | Tax Paid | Tax Assessment Tax Assessment Total Assessment is a certain percentage of the fair market value that is determined by local assessors to be the total taxable value of land and additions on the property. | Land | Improvement |
|---|---|---|---|---|
| 2025 | $2,271 | $34,320 | $8,950 | $25,370 |
| 2024 | $2,271 | $29,320 | $5,970 | $23,350 |
| 2023 | $2,157 | $29,320 | $5,970 | $23,350 |
| 2022 | $1,916 | $23,580 | $5,170 | $18,410 |
| 2021 | $1,883 | $23,580 | $5,170 | $18,410 |
| 2020 | $1,704 | $20,350 | $5,830 | $14,520 |
| 2019 | $1,699 | $20,350 | $5,830 | $14,520 |
| 2018 | $1,346 | $14,000 | $4,500 | $9,500 |
| 2016 | $1,240 | $12,630 | $3,170 | $9,460 |
Source: Public Records
Map
Nearby Homes
- 210 Horn Ave
- 229 Horn Ave
- 334 Horn Ave
- 612 Horn Ave
- 705 Lagro Ave
- 213 Waller Ave
- 715 Erskine Ave
- 112 Mann St
- 711 Erskine Ave
- 9533 Gentry Ave
- 816 Regina Ave
- 331 Rauhut Ave
- 939 Erskine Ave
- 9604 Gentry Ave
- 1036 Wachtel Ave
- 252 Wachtel Ave
- 423 Degenhardt Ave
- 235 Military Rd
- 231 E Velma Ave
- 251 Wachtel Ave
Your Personal Tour Guide
Ask me questions while you tour the home.