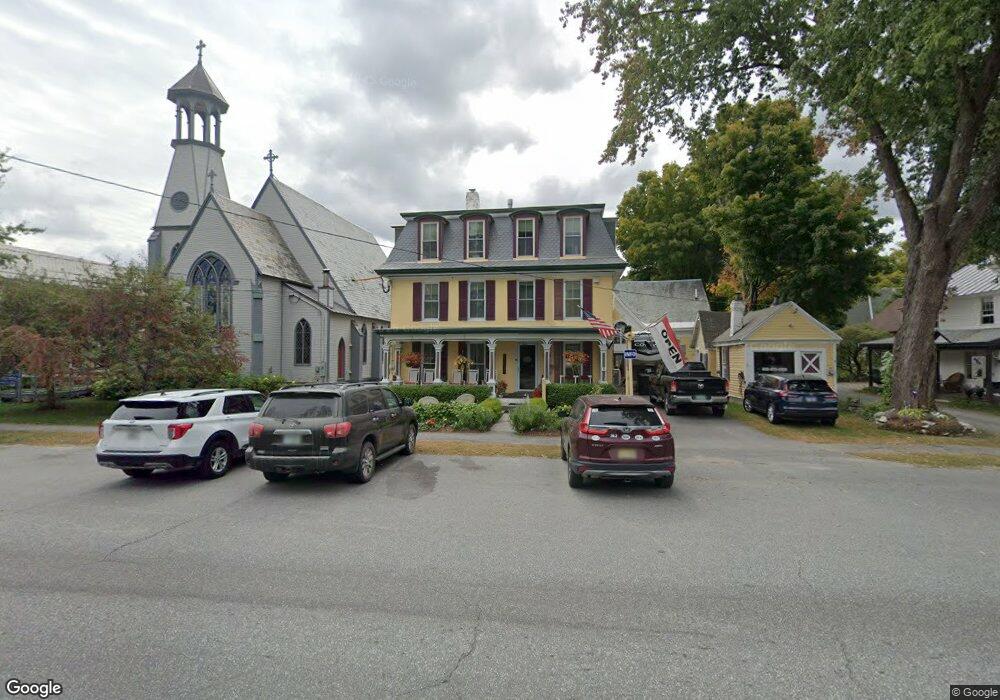
321 Main St Chester, VT 05143
Estimated Value: $1,471,230
8
Beds
10
Baths
6,384
Sq Ft
$230/Sq Ft
Est. Value
About This Home
This home is located at 321 Main St, Chester, VT 05143 and is currently estimated at $1,471,230, approximately $230 per square foot. 321 Main St is a home located in Windsor County with nearby schools including Chester-Andover Elementary School and Green Mountain Union High School.
Ownership History
Date
Name
Owned For
Owner Type
Purchase Details
Closed on
Jan 26, 2010
Sold by
Pierce Jonathan and Pierce Julie
Bought by
Inn Victoria Realty Llc
Current Estimated Value
Purchase Details
Closed on
Dec 21, 2006
Sold by
Pierce Victorian Inn Llc
Bought by
Pierce Jonathan and Pierce Julie
Purchase Details
Closed on
Mar 31, 2005
Sold by
Burns John T and Burns Janet T
Bought by
Pierre Victorian Inn Llc
Purchase Details
Closed on
Jan 5, 2000
Sold by
Lanagan Thomas P and Lanagan Kathleen
Bought by
Burns John W and Burns Janet T
Purchase Details
Closed on
May 16, 1988
Sold by
Murphy Barry K and Murphy Karen
Bought by
Lanagan Thomas P and Lanagan Kathleen M
Create a Home Valuation Report for This Property
The Home Valuation Report is an in-depth analysis detailing your home's value as well as a comparison with similar homes in the area
Home Values in the Area
Average Home Value in this Area
Purchase History
| Date | Buyer | Sale Price | Title Company |
|---|---|---|---|
| Inn Victoria Realty Llc | $660,000 | -- | |
| Inn Victoria Realty Llc | $660,000 | -- | |
| Pierce Jonathan | -- | -- | |
| Pierce Jonathan | -- | -- | |
| Pierre Victorian Inn Llc | $557,000 | -- | |
| Pierre Victorian Inn Llc | $557,000 | -- | |
| Burns John W | $380,000 | -- | |
| Burns John W | $380,000 | -- | |
| Lanagan Thomas P | $195,000 | -- | |
| Lanagan Thomas P | $195,000 | -- |
Source: Public Records
Tax History
| Year | Tax Paid | Tax Assessment Tax Assessment Total Assessment is a certain percentage of the fair market value that is determined by local assessors to be the total taxable value of land and additions on the property. | Land | Improvement |
|---|---|---|---|---|
| 2024 | $18,347 | $661,400 | $27,800 | $633,600 |
| 2023 | $10,500 | $661,400 | $27,800 | $633,600 |
| 2022 | $15,771 | $661,400 | $27,800 | $633,600 |
| 2021 | $16,231 | $661,400 | $27,800 | $633,600 |
| 2020 | $15,599 | $661,400 | $27,800 | $633,600 |
| 2019 | $14,628 | $696,900 | $71,200 | $625,700 |
| 2018 | $14,342 | $696,900 | $71,200 | $625,700 |
| 2017 | $0 | $696,900 | $71,200 | $625,700 |
| 2016 | $0 | $696,900 | $71,200 | $625,700 |
| 2015 | -- | $6,969 | $0 | $0 |
| 2014 | -- | $6,969 | $0 | $0 |
| 2013 | -- | $6,969 | $0 | $0 |
Source: Public Records
Map
Nearby Homes
- 95 Church St
- 531 Main St
- 00 Vermont 103
- 160 Depot St
- 419 Coach Rd
- 534 Elm St
- 447 Elm St
- 41 Vt Route 103 S
- 514 1st Ave
- 00 Quarry Rd
- 918 Lovers Lane Rd
- 1175 Quarry Rd
- 00 Vt Route 103 N
- 000 Green Mountain Turnpike
- 00 Remington Rd
- 1397 Popple Dungeon Rd
- 1876 Popple Dungeon Rd
- 40 Fenton Rd
- 688 Hidden Heights Rd
- 187 Lacross Rd
Your Personal Tour Guide
Ask me questions while you tour the home.