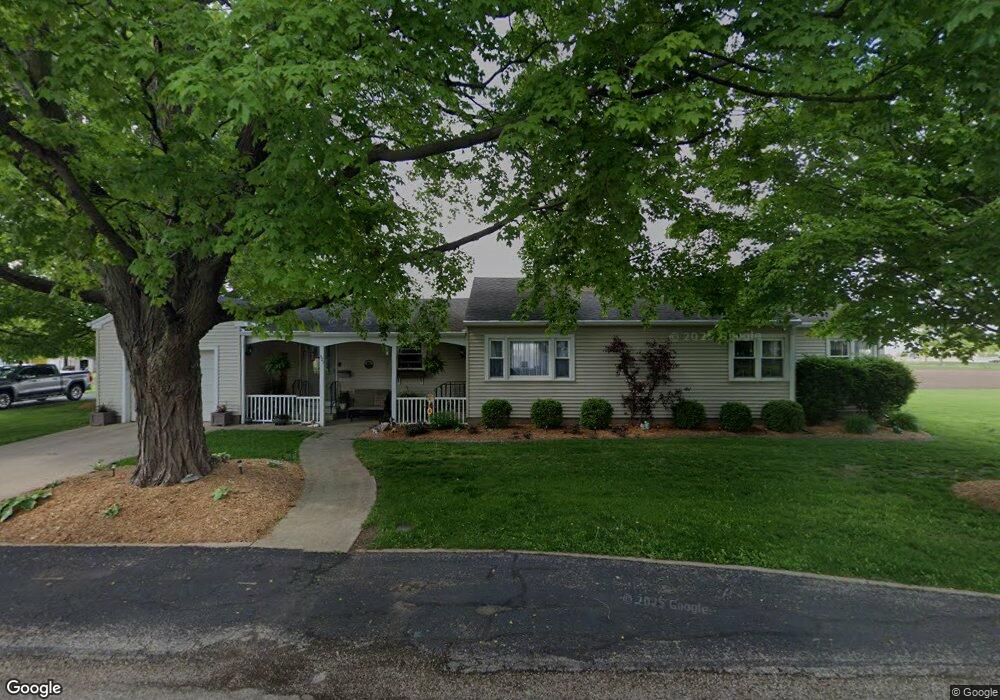
321 Maple Ave Charleston, IL 61920
Estimated Value: $81,000 - $127,000
2
Beds
2
Baths
1,218
Sq Ft
$82/Sq Ft
Est. Value
About This Home
This home is located at 321 Maple Ave, Charleston, IL 61920 and is currently estimated at $100,063, approximately $82 per square foot. 321 Maple Ave is a home located in Coles County with nearby schools including Charleston High School and Charleston Christian Academy.
Create a Home Valuation Report for This Property
The Home Valuation Report is an in-depth analysis detailing your home's value as well as a comparison with similar homes in the area
Home Values in the Area
Average Home Value in this Area
Tax History Compared to Growth
Tax History
| Year | Tax Paid | Tax Assessment Tax Assessment Total Assessment is a certain percentage of the fair market value that is determined by local assessors to be the total taxable value of land and additions on the property. | Land | Improvement |
|---|---|---|---|---|
| 2024 | $2,271 | $35,269 | $12,690 | $22,579 |
| 2023 | $2,193 | $32,209 | $11,589 | $20,620 |
| 2022 | $2,189 | $31,677 | $11,398 | $20,279 |
| 2021 | $2,257 | $30,401 | $10,939 | $19,462 |
| 2020 | $1,882 | $26,939 | $11,334 | $15,605 |
| 2019 | $1,832 | $26,000 | $10,939 | $15,061 |
| 2018 | $1,813 | $26,000 | $10,939 | $15,061 |
| 2017 | $2,325 | $26,000 | $10,939 | $15,061 |
| 2016 | $2,306 | $26,000 | $10,939 | $15,061 |
| 2015 | $3,079 | $26,000 | $10,939 | $15,061 |
| 2014 | $3,079 | $33,629 | $10,939 | $22,690 |
| 2013 | $3,079 | $33,629 | $10,939 | $22,690 |
Source: Public Records
Map
Nearby Homes