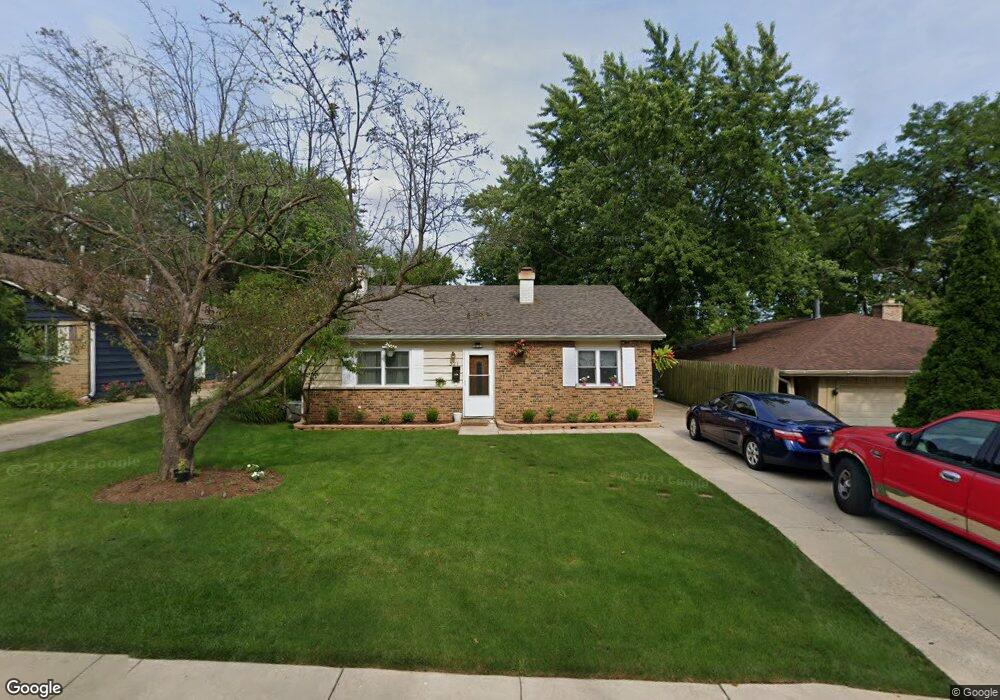
321 N Garfield Ave Mundelein, IL 60060
Estimated Value: $254,000 - $305,805
3
Beds
2
Baths
1,015
Sq Ft
$286/Sq Ft
Est. Value
About This Home
This home is located at 321 N Garfield Ave, Mundelein, IL 60060 and is currently estimated at $290,701, approximately $286 per square foot. 321 N Garfield Ave is a home located in Lake County with nearby schools including Washington Early Learning Center, Mechanics Grove Elementary School, and Carl Sandburg Middle School.
Ownership History
Date
Name
Owned For
Owner Type
Purchase Details
Closed on
Jun 21, 2023
Sold by
Sharma Ramesh C
Bought by
Hernandez Miguel
Current Estimated Value
Home Financials for this Owner
Home Financials are based on the most recent Mortgage that was taken out on this home.
Original Mortgage
$7,500
Outstanding Balance
$1,070
Interest Rate
6.39%
Mortgage Type
New Conventional
Estimated Equity
$289,631
Purchase Details
Closed on
Nov 21, 2012
Sold by
Deutsche Bank National Trust Co
Bought by
Sharma Ramesh C
Purchase Details
Closed on
Nov 5, 2012
Sold by
Hernandez Elsa and Hernandez Gerardo
Bought by
Deutshe Bank National Trust Co
Purchase Details
Closed on
Nov 30, 2005
Sold by
Carroll Mary and Carroll Mary M
Bought by
Hernandez Gerardo and Hernandez Elsa
Home Financials for this Owner
Home Financials are based on the most recent Mortgage that was taken out on this home.
Original Mortgage
$160,000
Interest Rate
7.5%
Mortgage Type
Purchase Money Mortgage
Create a Home Valuation Report for This Property
The Home Valuation Report is an in-depth analysis detailing your home's value as well as a comparison with similar homes in the area
Home Values in the Area
Average Home Value in this Area
Purchase History
| Date | Buyer | Sale Price | Title Company |
|---|---|---|---|
| Hernandez Miguel | $215,000 | Chicago Title | |
| Sharma Ramesh C | $58,800 | None Available | |
| Deutshe Bank National Trust Co | -- | None Available | |
| Hernandez Gerardo | $200,000 | Multiple |
Source: Public Records
Mortgage History
| Date | Status | Borrower | Loan Amount |
|---|---|---|---|
| Open | Hernandez Miguel | $7,500 | |
| Open | Hernandez Miguel | $211,105 | |
| Previous Owner | Hernandez Gerardo | $160,000 |
Source: Public Records
Tax History Compared to Growth
Tax History
| Year | Tax Paid | Tax Assessment Tax Assessment Total Assessment is a certain percentage of the fair market value that is determined by local assessors to be the total taxable value of land and additions on the property. | Land | Improvement |
|---|---|---|---|---|
| 2024 | $8,002 | $82,231 | $16,506 | $65,725 |
| 2023 | $7,490 | $75,345 | $15,124 | $60,221 |
| 2022 | $7,490 | $69,620 | $14,358 | $55,262 |
| 2021 | $7,181 | $67,181 | $13,855 | $53,326 |
| 2020 | $7,078 | $65,332 | $13,474 | $51,858 |
| 2019 | $6,861 | $63,184 | $13,031 | $50,153 |
| 2018 | $6,119 | $55,548 | $12,427 | $43,121 |
| 2017 | $5,981 | $53,800 | $12,036 | $41,764 |
| 2016 | $5,850 | $51,097 | $11,431 | $39,666 |
| 2015 | $5,735 | $47,902 | $10,716 | $37,186 |
| 2014 | $2,282 | $19,426 | $10,622 | $8,804 |
| 2012 | $4,986 | $47,579 | $10,716 | $36,863 |
Source: Public Records
Map
Nearby Homes
- 29746 U S 45
- 331 Plaza Cir
- 742 N Lake St
- 207 N Idlewild Ave
- 619 N California Ave Unit 1
- 547 N Ridgemoor Ave
- 851 Glenview Ave
- 728 W Maple Ave
- 250 N Fairlawn Ave
- 26220 N Midlothian Rd
- 939 Ridgeland Ave
- 116 S Pershing Ave
- 659 E Maple Ave
- 281 N Shaddle Ave
- 728 E Hawley St
- 1297 Spalding Dr
- 973 Highland Rd
- 422 James Ave
- 1305 Spalding Dr
- 841 Wilcox St
- 315 N Garfield Ave
- 327 N Garfield Ave
- 309 N Garfield Ave
- 136 W Hammond St
- 127 W Hawley St
- 133 W Hawley St
- 121 W Hawley St
- 322 N Lincoln Ave
- 316 N Lincoln Ave
- 328 N Lincoln Ave
- 115 W Hawley St
- 310 N Lincoln Ave
- 322 N Garfield Ave
- 109 W Hawley St
- 316 N Garfield Ave
- 304 N Lincoln Ave Unit 9B21
- 328 N Garfield Ave
- 203 W Hawley St
- 310 N Garfield Ave
- 135 W Hammond St