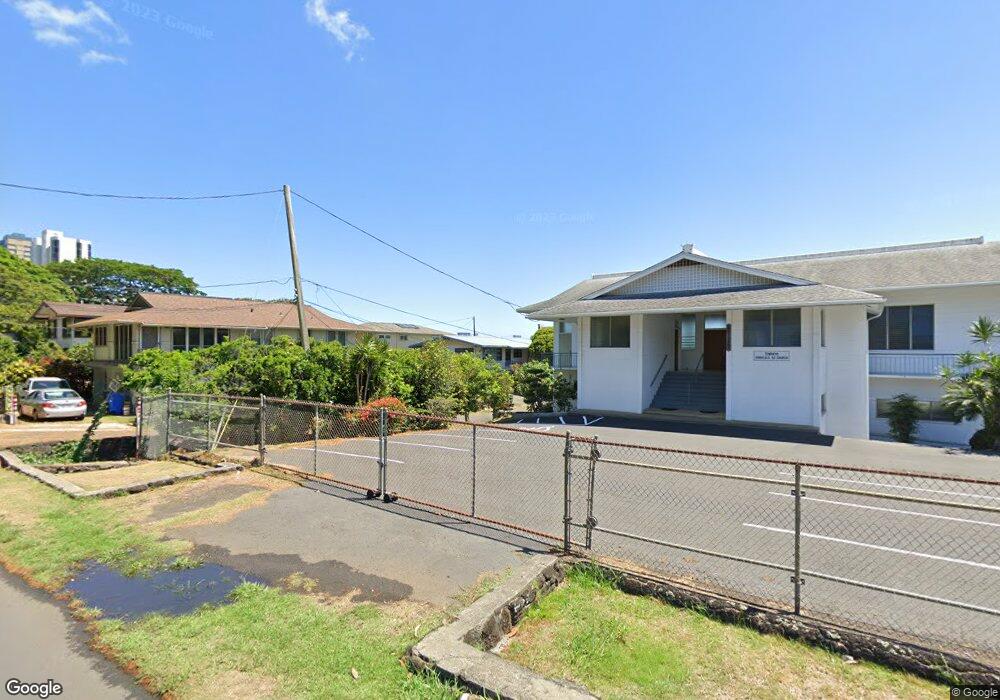
321 N Judd St Unit B Honolulu, HI 96817
Liliha-Kapalama NeighborhoodEstimated Value: $1,099,911 - $1,421,000
4
Beds
2
Baths
1,581
Sq Ft
$804/Sq Ft
Est. Value
About This Home
This home is located at 321 N Judd St Unit B, Honolulu, HI 96817 and is currently estimated at $1,271,728, approximately $804 per square foot. 321 N Judd St Unit B is a home located in Honolulu County with nearby schools including Maemae Elementary School, Prince David Kawananakoa Middle School, and President William McKinley High School.
Ownership History
Date
Name
Owned For
Owner Type
Purchase Details
Closed on
Apr 4, 2025
Sold by
Frank C K Chang Trust and Chang Lillian S
Bought by
Lillian S L Chang Trust and Chang
Current Estimated Value
Purchase Details
Closed on
Sep 9, 2016
Sold by
Lin Chang Frank Chu Kong and Lin Chang Lillian Siu
Bought by
Chang Frank C K and Chang Lillian S L
Purchase Details
Closed on
Aug 7, 2015
Sold by
Lin Chang Frank Chu Kong and Lin Chang Lillian Siu
Bought by
Chang Frank C K and Chang Lillian S L
Purchase Details
Closed on
Sep 11, 1998
Sold by
Yau Chung Tai
Bought by
Yau Chung Tai and Wong Chung Norah
Purchase Details
Closed on
Jun 11, 1998
Sold by
Lin Chang Lillian Siu and Chang Lillian S L
Bought by
Chang Lillian S L and Chang Frank C K
Create a Home Valuation Report for This Property
The Home Valuation Report is an in-depth analysis detailing your home's value as well as a comparison with similar homes in the area
Home Values in the Area
Average Home Value in this Area
Purchase History
| Date | Buyer | Sale Price | Title Company |
|---|---|---|---|
| Lillian S L Chang Trust | -- | None Listed On Document | |
| Chang Frank C K | -- | Accommodation | |
| Lin Chang Fran K Chu Kong | $400,000 | Accommodation | |
| Chang Frank C K | -- | Accommodation | |
| Lin Chang Fran K Chu Kong | $400,000 | Accommodation | |
| Chang Frank C K | -- | None Available | |
| Lin Chang Frank Chu Kong | -- | None Available | |
| Chang Frank C K | -- | None Available | |
| Lin Chang Frank Chu Kong | -- | None Available | |
| Yau Chung Tai | -- | -- | |
| Chang Lillian S L | -- | Island Title Corp |
Source: Public Records
Tax History Compared to Growth
Tax History
| Year | Tax Paid | Tax Assessment Tax Assessment Total Assessment is a certain percentage of the fair market value that is determined by local assessors to be the total taxable value of land and additions on the property. | Land | Improvement |
|---|---|---|---|---|
| 2025 | $5,862 | $1,232,600 | $970,100 | $262,500 |
| 2024 | $5,862 | $1,163,300 | $970,100 | $193,200 |
| 2023 | $6,502 | $1,219,500 | $975,100 | $244,400 |
| 2022 | $3,246 | $927,300 | $798,100 | $129,200 |
| 2021 | $2,885 | $824,300 | $663,700 | $160,600 |
| 2020 | $2,920 | $834,300 | $630,100 | $204,200 |
| 2019 | $2,822 | $806,200 | $630,100 | $176,100 |
| 2018 | $2,622 | $749,200 | $579,700 | $169,500 |
| 2017 | $2,645 | $755,700 | $554,500 | $201,200 |
| 2016 | $2,400 | $685,600 | $537,700 | $147,900 |
| 2015 | $2,261 | $646,000 | $470,500 | $175,500 |
| 2014 | -- | $589,600 | $428,400 | $161,200 |
Source: Public Records
Map
Nearby Homes
- 2050 Nuuanu Ave Unit DH106
- 2040 Nuuanu Ave Unit 1203
- 2040 Nuuanu Ave Unit 1602
- 2040 Nuuanu Ave Unit 1103
- 2040 Nuuanu Ave Unit 404
- 2040 Nuuanu Ave Unit 1804
- 2029 Nuuanu Ave Unit 1105
- 2029 Nuuanu Ave Unit 904
- 2101 Nuuanu Ave Unit I303
- 21 Craigside Place Unit 8D
- 55 S Judd St Unit 803
- 55 S Judd St Unit 1501
- 55 S Judd St Unit 705
- 55 S Judd St Unit 2206
- 55 S Judd St Unit 1901
- 1934 Pauoa Rd
- 441 Kanani Place Unit 1
- 1940 Pacific Heights Rd
- 2214 Liliha St
- 2222 Liliha St
- 321 N Judd St
- 321 N Judd St Unit A
- 321 N Judd St Unit C
- 315 N Judd St
- 313 N Judd St
- 320 N Judd St
- 349 N Judd St
- 243 N Judd St
- 243 N Judd St Unit A1
- 243 N Judd St Unit C
- 243 N Judd St Unit D
- 250 N Judd St
- 2051 Lee Place
- 409 N Judd St
- 240 N Judd St
- 2039 Lee Place
- 217 N Judd St
- 217 N Judd St Unit C
- 217 N Judd St Unit E
- 164 N Judd St