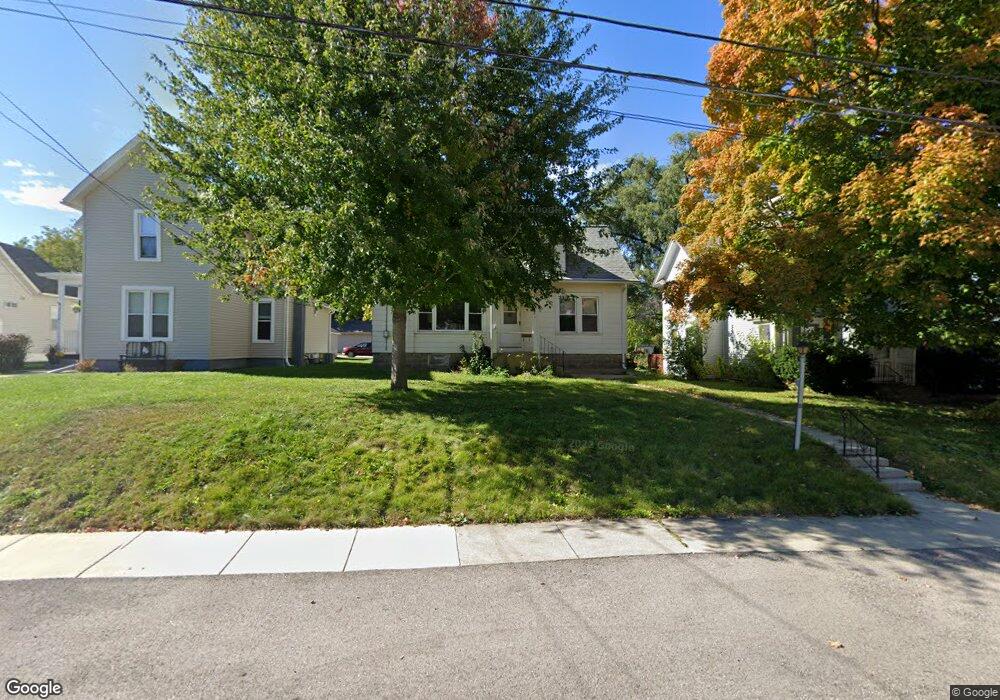
321 N Locust St Sycamore, IL 60178
Estimated Value: $290,420 - $318,000
5
Beds
3
Baths
1,145
Sq Ft
$268/Sq Ft
Est. Value
About This Home
This home is located at 321 N Locust St, Sycamore, IL 60178 and is currently estimated at $306,355, approximately $267 per square foot. 321 N Locust St is a home located in DeKalb County with nearby schools including Sycamore High School, St Mary's Catholic School, and Cornerstone Christian Academy.
Ownership History
Date
Name
Owned For
Owner Type
Purchase Details
Closed on
Jan 26, 2007
Sold by
Neubauer Richard L
Bought by
Collie Trevor G and Collie Denise K R
Current Estimated Value
Home Financials for this Owner
Home Financials are based on the most recent Mortgage that was taken out on this home.
Original Mortgage
$164,800
Outstanding Balance
$98,708
Interest Rate
6.16%
Mortgage Type
New Conventional
Estimated Equity
$207,647
Create a Home Valuation Report for This Property
The Home Valuation Report is an in-depth analysis detailing your home's value as well as a comparison with similar homes in the area
Home Values in the Area
Average Home Value in this Area
Purchase History
| Date | Buyer | Sale Price | Title Company |
|---|---|---|---|
| Collie Trevor G | $206,000 | -- |
Source: Public Records
Mortgage History
| Date | Status | Borrower | Loan Amount |
|---|---|---|---|
| Open | Collie Trevor G | $164,800 |
Source: Public Records
Tax History Compared to Growth
Tax History
| Year | Tax Paid | Tax Assessment Tax Assessment Total Assessment is a certain percentage of the fair market value that is determined by local assessors to be the total taxable value of land and additions on the property. | Land | Improvement |
|---|---|---|---|---|
| 2024 | $5,403 | $72,386 | $11,829 | $60,557 |
| 2023 | $5,321 | $66,100 | $10,802 | $55,298 |
| 2022 | $5,066 | $59,451 | $9,907 | $49,544 |
| 2021 | $4,806 | $55,812 | $9,301 | $46,511 |
| 2020 | $4,733 | $54,440 | $9,072 | $45,368 |
| 2019 | $4,650 | $53,247 | $8,873 | $44,374 |
| 2018 | $4,563 | $51,631 | $8,604 | $43,027 |
| 2017 | $4,440 | $49,588 | $8,264 | $41,324 |
| 2016 | $4,320 | $47,326 | $7,887 | $39,439 |
| 2015 | -- | $44,542 | $7,423 | $37,119 |
| 2014 | -- | $42,296 | $7,049 | $35,247 |
| 2013 | -- | $43,106 | $7,184 | $35,922 |
Source: Public Records
Map
Nearby Homes
- 321 N Locust St
- Lot 1 Route 23
- 434 E Exchange St Unit 2
- 1936 Galloway Ct
- 1929 Galloway Ct
- 459 E State St
- 412 W Elm St
- 113 E Ottawa St
- 211 E Ottawa St
- 335 North Ave
- 56 Briden Ln Unit 56
- 45 Briden Ln Unit 45
- 44 Kloe Ln Unit 44
- 740 W State St
- 60 Kloe Ln Unit 60
- 1152 Rose Dr
- 1120 Oxford Cir
- 64 Kloe Ln Unit 64
- 822 Dekalb Ave
- 732 Park Ave
- 327 N Locust St
- 313 N Locust St
- 313 N Locust St
- 320 N Locust St
- 314 N Locust St Unit 314-LL
- 314 N Locust St Unit 314-UPPER
- 330 N Locust St
- 316 N Locust St Unit 316
- 304 N Locust St
- 129 E Sycamore St
- 111 E Sycamore St
- 212 E Sycamore St
- 320 N Main St
- 304 N Main St
- 334 N Main St
- 344 N Main St
- 220 E Sycamore St
- 223 E Sycamore St
- 307 N Main St