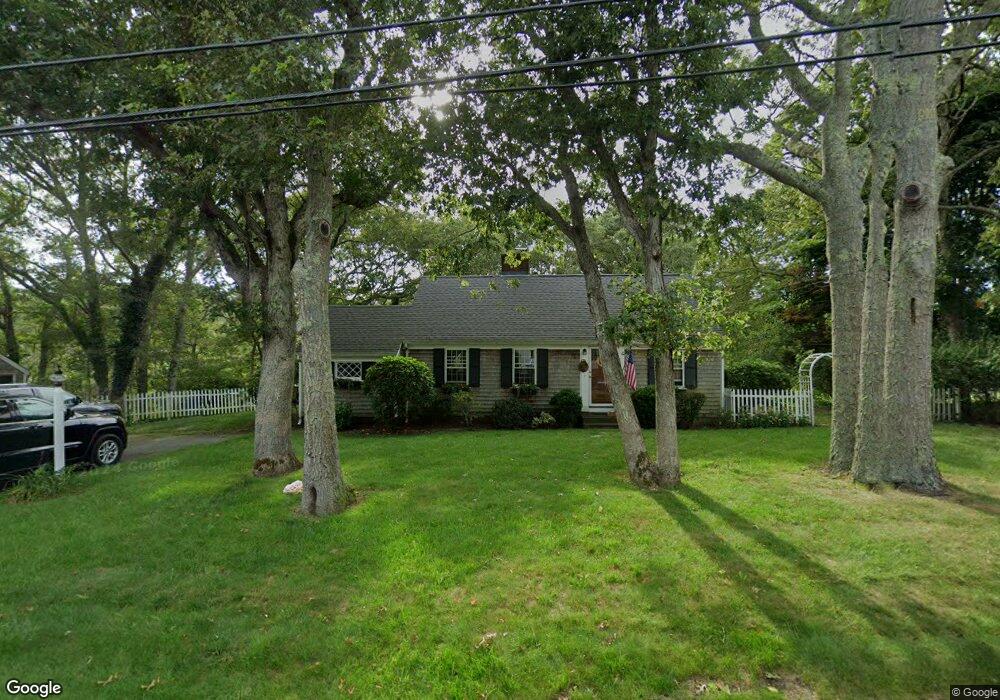
321 N Main St South Yarmouth, MA 02664
Estimated Value: $513,000 - $577,000
3
Beds
2
Baths
1,501
Sq Ft
$370/Sq Ft
Est. Value
About This Home
This home is located at 321 N Main St, South Yarmouth, MA 02664 and is currently estimated at $555,983, approximately $370 per square foot. 321 N Main St is a home located in Barnstable County with nearby schools including Dennis-Yarmouth Regional High School and St. Pius X. School.
Ownership History
Date
Name
Owned For
Owner Type
Purchase Details
Closed on
Feb 12, 2007
Sold by
Kaup Deborah F and Kaup Edward F
Bought by
Kaup Rachel B
Current Estimated Value
Home Financials for this Owner
Home Financials are based on the most recent Mortgage that was taken out on this home.
Original Mortgage
$95,000
Outstanding Balance
$57,090
Interest Rate
6.22%
Mortgage Type
Purchase Money Mortgage
Estimated Equity
$498,893
Create a Home Valuation Report for This Property
The Home Valuation Report is an in-depth analysis detailing your home's value as well as a comparison with similar homes in the area
Home Values in the Area
Average Home Value in this Area
Purchase History
| Date | Buyer | Sale Price | Title Company |
|---|---|---|---|
| Kaup Rachel B | $295,000 | -- |
Source: Public Records
Mortgage History
| Date | Status | Borrower | Loan Amount |
|---|---|---|---|
| Open | Kaup Rachel B | $95,000 |
Source: Public Records
Tax History Compared to Growth
Tax History
| Year | Tax Paid | Tax Assessment Tax Assessment Total Assessment is a certain percentage of the fair market value that is determined by local assessors to be the total taxable value of land and additions on the property. | Land | Improvement |
|---|---|---|---|---|
| 2025 | $3,215 | $454,100 | $177,100 | $277,000 |
| 2024 | $2,970 | $402,500 | $154,000 | $248,500 |
| 2023 | $2,916 | $359,500 | $133,300 | $226,200 |
| 2022 | $2,680 | $291,900 | $121,100 | $170,800 |
| 2021 | $2,653 | $277,500 | $121,100 | $156,400 |
| 2020 | $2,587 | $258,700 | $121,100 | $137,600 |
| 2019 | $2,445 | $242,100 | $121,100 | $121,000 |
| 2018 | $2,307 | $224,200 | $103,200 | $121,000 |
| 2017 | $2,201 | $219,700 | $98,700 | $121,000 |
| 2016 | $2,103 | $210,700 | $89,700 | $121,000 |
| 2015 | $2,166 | $215,700 | $89,700 | $126,000 |
Source: Public Records
Map
Nearby Homes
- 30 Pebble Beach Way
- 91 Chipping Green Cir
- 21 Green Way
- 1 Country Club Dr
- 23 Fairwood Rd
- 140 Diane Ave
- 4 Raymond Ave
- 85 Keel Cape Dr
- 8 Viking Rock Rd
- 37 Winsome Rd
- 18 Curve Hill Rd
- 116 N Main St
- 18 Turner Ln
- 176 Beacon St
- 38 N Dennis Rd
- 29 Bass River Rd
- 7 Sunset Pines Rd
- 24 Hazelmoor Rd
- 61 Station Ave
- 329 N Main St
- 320 N Main St
- 307 N Main St
- 2 Peace Ln
- 8 Peace Ln
- 4 Mid Iron Dr
- 341 N Main St
- 8 Mid Iron Dr
- 352 N Main St
- 1 Mid Iron Dr
- 1 Midiron Dr
- 345 N Main St
- 7 Mid Iron Dr
- 290 N Main St
- 57 Pebble Beach Way Unit 59
- 57-59 Pebble Beach Way
- 17 Mid Iron Dr
- 56 Pebble Beach Way
- 56 Pepple Beach Rd
- 76 Country Club Dr