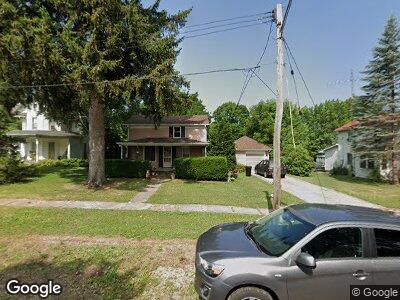
321 N Spring St Franklin Grove, IL 61031
Franklin Grove-Nachusa NeighborhoodEstimated Value: $87,953 - $176,000
3
Beds
1
Bath
1,737
Sq Ft
$73/Sq Ft
Est. Value
About This Home
This home is located at 321 N Spring St, Franklin Grove, IL 61031 and is currently estimated at $125,988, approximately $72 per square foot. 321 N Spring St is a home located in Lee County with nearby schools including Ashton-Franklin Center Elementary School, Ashton-Franklin Center Middle School, and Ashton-Franklin Center High School.
Ownership History
Date
Name
Owned For
Owner Type
Purchase Details
Closed on
Jun 30, 2009
Sold by
Pfoutz Sra Lee
Bought by
Marciniec Jill M
Current Estimated Value
Home Financials for this Owner
Home Financials are based on the most recent Mortgage that was taken out on this home.
Original Mortgage
$74,623
Outstanding Balance
$48,178
Interest Rate
4.86%
Mortgage Type
FHA
Estimated Equity
$77,810
Create a Home Valuation Report for This Property
The Home Valuation Report is an in-depth analysis detailing your home's value as well as a comparison with similar homes in the area
Home Values in the Area
Average Home Value in this Area
Purchase History
| Date | Buyer | Sale Price | Title Company |
|---|---|---|---|
| Marciniec Jill M | $76,000 | None Available |
Source: Public Records
Mortgage History
| Date | Status | Borrower | Loan Amount |
|---|---|---|---|
| Open | Marciniec Jill M | $74,623 |
Source: Public Records
Tax History Compared to Growth
Tax History
| Year | Tax Paid | Tax Assessment Tax Assessment Total Assessment is a certain percentage of the fair market value that is determined by local assessors to be the total taxable value of land and additions on the property. | Land | Improvement |
|---|---|---|---|---|
| 2024 | $1,428 | $23,528 | $4,586 | $18,942 |
| 2023 | $1,208 | $20,459 | $3,988 | $16,471 |
| 2022 | $1,098 | $18,770 | $3,659 | $15,111 |
| 2021 | $1,103 | $18,751 | $3,538 | $15,213 |
| 2020 | $1,070 | $18,205 | $3,435 | $14,770 |
| 2019 | $1,045 | $17,675 | $3,335 | $14,340 |
| 2018 | $947 | $16,833 | $3,176 | $13,657 |
| 2017 | $949 | $16,833 | $3,176 | $13,657 |
| 2016 | $953 | $16,833 | $3,176 | $13,657 |
| 2015 | $960 | $16,833 | $3,176 | $13,657 |
| 2014 | $963 | $16,833 | $3,176 | $13,657 |
| 2013 | $1,419 | $22,724 | $3,779 | $18,945 |
Source: Public Records
Map
Nearby Homes
- 124 W Middle St
- 247 W Maple St
- 326 Old Mill Rd
- 215 W Hughes St
- Lot 4 Daysville Rd
- 1479 Old Mill Rd
- 1841 Robbins Rd
- 8554 S Daysville Rd
- 511 Richardson Ave
- 908 Main St
- 808 Evans Ave
- 1735 Nachusa Rd
- 1003 Cartwright Ave
- 110 Flambeau Ln
- 203 Flambeau Ln
- 214 Park Dr
- 103 Wolf Dr
- 107 Maple Ln
- 217 Park Dr
- 105 Oak Ln
- 321 N Spring St
- 315 N Spring St
- 327 N Spring St
- 309 N Spring St
- 318 N Spring St
- 326 N Spring St
- 301 N Spring St
- 220 W Lincoln Hwy
- 338 N Spring St
- 227 N Spring St
- 226 W Lincoln Hwy
- 242 N State St
- 252 N State St
- 217 N Spring St
- 238 N State St
- 234 W Lincoln Hwy
- 321 N Elm St
- 222 N Spring St
- 248 N State St
- 325 N Elm St