Estimated Value: $181,065 - $196,000
3
Beds
1
Bath
1,692
Sq Ft
$111/Sq Ft
Est. Value
About This Home
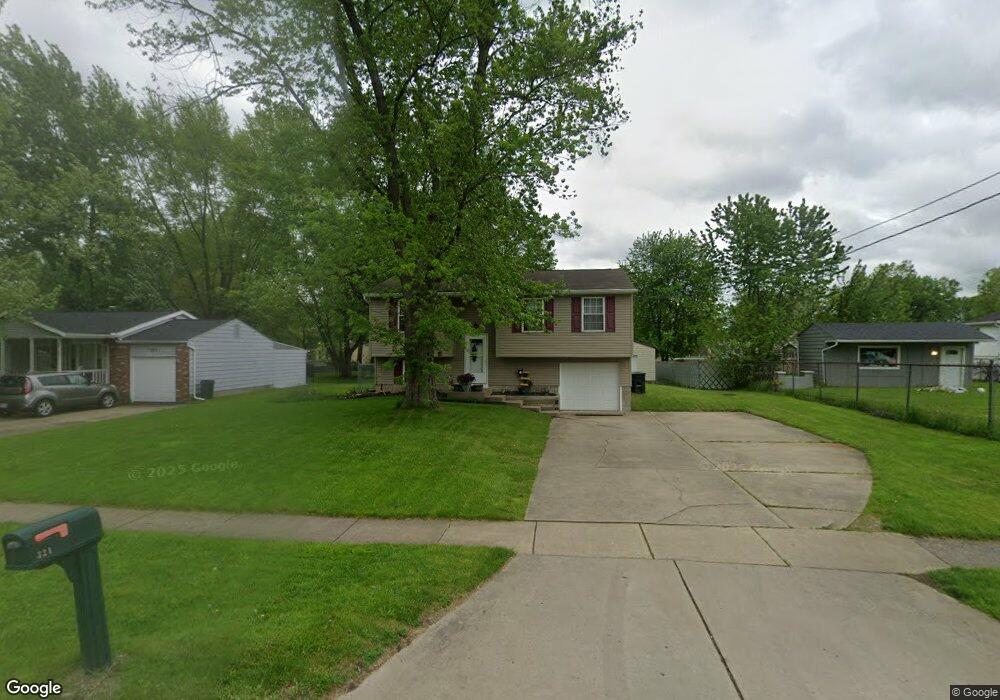
This home is located at 321 North Rd, Niles, OH 44446 and is currently estimated at $187,266, approximately $110 per square foot. 321 North Rd is a home located in Trumbull County with nearby schools including Niles Primary School, Niles Intermediate School, and Niles Middle School.
Ownership History
Date
Name
Owned For
Owner Type
Purchase Details
Closed on
Jul 24, 2014
Sold by
Parsons Kevin D and Parsons Debra A
Bought by
Parsons Kevin D and Parsons Debra A
Current Estimated Value
Purchase Details
Closed on
Mar 22, 1994
Sold by
Kist Robert
Bought by
Kevin D Parsons Debra A Parsons
Purchase Details
Closed on
Jan 1, 1990
Bought by
Robert Kist
Create a Home Valuation Report for This Property
The Home Valuation Report is an in-depth analysis detailing your home's value as well as a comparison with similar homes in the area
Home Values in the Area
Average Home Value in this Area
Purchase History
| Date | Buyer | Sale Price | Title Company |
|---|---|---|---|
| Parsons Kevin D | -- | None Available | |
| Kevin D Parsons Debra A Parsons | $56,000 | -- | |
| Robert Kist | -- | -- |
Source: Public Records
Tax History Compared to Growth
Tax History
| Year | Tax Paid | Tax Assessment Tax Assessment Total Assessment is a certain percentage of the fair market value that is determined by local assessors to be the total taxable value of land and additions on the property. | Land | Improvement |
|---|---|---|---|---|
| 2024 | $1,667 | $39,870 | $4,620 | $35,250 |
| 2023 | $1,667 | $39,870 | $4,620 | $35,250 |
| 2022 | $1,441 | $29,440 | $4,620 | $24,820 |
| 2021 | $1,514 | $29,440 | $4,620 | $24,820 |
| 2020 | $1,527 | $29,440 | $4,620 | $24,820 |
| 2019 | $1,597 | $29,300 | $4,620 | $24,680 |
| 2018 | $1,592 | $29,300 | $4,620 | $24,680 |
| 2017 | $1,583 | $29,300 | $4,620 | $24,680 |
| 2016 | $1,429 | $26,250 | $4,620 | $21,630 |
| 2015 | $1,413 | $26,250 | $4,620 | $21,630 |
| 2014 | $1,418 | $26,250 | $4,620 | $21,630 |
| 2013 | $1,417 | $27,620 | $4,620 | $23,000 |
Source: Public Records
Map
Nearby Homes
- 245 North Rd
- 613 North Rd
- 0 Harrison St
- 145 North Rd
- 1313 Deforest Rd SE
- 164 Summerberry Ln
- 57 Wilson Ave
- 695 Trumbull Dr
- 1187 Deforest Rd SE
- 1541 N Main St
- 820 Cynthia Ct
- 3744 Valacamp Ave SE
- 47 Woodland Chase Blvd Unit 47
- 34 Franklin Ave
- 834 Bowman St
- 38 Franklin Ave
- 5375 East Dr
- 1529 Difford Dr
- 512 John St
- 0 Federal
- 327 North Rd
- 11 Cassandra Dr
- 19 Cassandra Dr
- 335 North Rd
- 101 Bentwillow Dr
- 27 Cassandra Dr
- 105 Bentwillow Dr
- 35 Cassandra Dr
- 310 North Rd
- 109 Bentwillow Dr
- 0 Roberts St SE
- 0 North Rd Unit 4462844
- 0 North Rd
- 413 North Rd
- 300 North Rd
- 113 Bentwillow Dr
- 112 Bentwillow Dr
- 20 Cassandra Dr
- 12 Cassandra Dr
- 103 Cassandra Dr