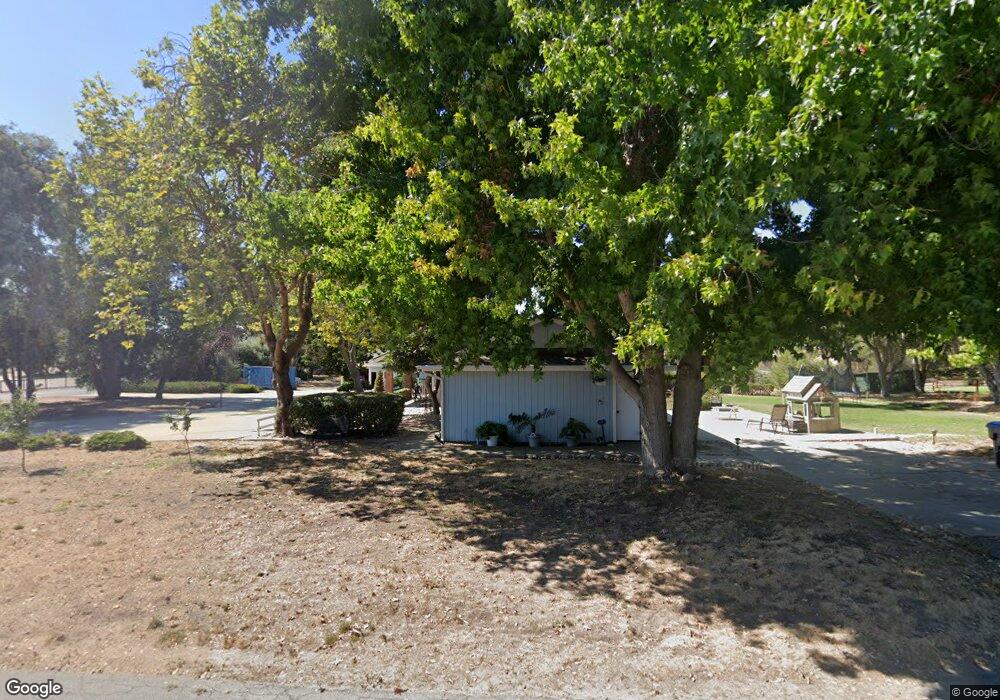
321 Pajaro Ln Nipomo, CA 93444
Estimated Value: $1,000,000 - $1,329,000
4
Beds
3
Baths
2,647
Sq Ft
$431/Sq Ft
Est. Value
About This Home
This home is located at 321 Pajaro Ln, Nipomo, CA 93444 and is currently estimated at $1,141,461, approximately $431 per square foot. 321 Pajaro Ln is a home located in San Luis Obispo County with nearby schools including Dorothea Lange Elementary School, Mesa Middle School, and Nipomo High School.
Ownership History
Date
Name
Owned For
Owner Type
Purchase Details
Closed on
Nov 4, 2024
Sold by
Jenkins Jerry and Jenkins Carmen
Bought by
Jenkins Family Revocable Trust and Jenkins
Current Estimated Value
Purchase Details
Closed on
Jul 5, 1995
Sold by
Transamerica Financial Services
Bought by
Jenkins Jerry and Jenkins Carmen
Home Financials for this Owner
Home Financials are based on the most recent Mortgage that was taken out on this home.
Original Mortgage
$215,081
Interest Rate
7.59%
Mortgage Type
Seller Take Back
Purchase Details
Closed on
Jun 1, 1995
Sold by
Smith Les D
Bought by
Transamerica Financial Services
Home Financials for this Owner
Home Financials are based on the most recent Mortgage that was taken out on this home.
Original Mortgage
$215,081
Interest Rate
7.59%
Mortgage Type
Seller Take Back
Create a Home Valuation Report for This Property
The Home Valuation Report is an in-depth analysis detailing your home's value as well as a comparison with similar homes in the area
Home Values in the Area
Average Home Value in this Area
Purchase History
| Date | Buyer | Sale Price | Title Company |
|---|---|---|---|
| Jenkins Family Revocable Trust | -- | None Listed On Document | |
| Jenkins Jerry | $220,000 | Chicago Title Co | |
| Transamerica Financial Services | $145,000 | -- |
Source: Public Records
Mortgage History
| Date | Status | Borrower | Loan Amount |
|---|---|---|---|
| Previous Owner | Jenkins Jerry | $215,081 |
Source: Public Records
Tax History
| Year | Tax Paid | Tax Assessment Tax Assessment Total Assessment is a certain percentage of the fair market value that is determined by local assessors to be the total taxable value of land and additions on the property. | Land | Improvement |
|---|---|---|---|---|
| 2025 | $3,759 | $365,437 | $174,412 | $191,025 |
| 2024 | $3,716 | $358,273 | $170,993 | $187,280 |
| 2023 | $3,716 | $351,249 | $167,641 | $183,608 |
| 2022 | $3,660 | $344,362 | $164,354 | $180,008 |
| 2021 | $3,653 | $337,611 | $161,132 | $176,479 |
| 2020 | $3,611 | $334,150 | $159,480 | $174,670 |
| 2019 | $3,589 | $327,599 | $156,353 | $171,246 |
| 2018 | $3,546 | $321,177 | $153,288 | $167,889 |
| 2017 | $3,480 | $314,881 | $150,283 | $164,598 |
| 2016 | $3,282 | $308,708 | $147,337 | $161,371 |
| 2015 | $3,235 | $304,072 | $145,124 | $158,948 |
| 2014 | $3,115 | $298,117 | $142,282 | $155,835 |
Source: Public Records
Map
Nearby Homes
- 340 N Las Flores Dr
- 341 N Las Flores Dr
- 250 Via Promesa
- 1431 La Loma Dr
- 366 Venus Ct
- 161 Lot Scenic View Way
- 0 Scenic View Way
- 585 Via Mira Valle
- 1685 Scenic View Way
- 353 Uranus Ct
- 429 Saturn Ct
- 468 Neptune Dr
- 1655 Kirby Way
- 426 Polaris Dr
- 1765 Division St
- 1089 Olympic Way
- 680 Sweet Donna Place
- 945 Jeanette Ln
- 850 Primrose Ln
- 0 Indiana Way Unit PI25034009
- 341 Pajaro Ln
- 340 Pajaro Ln
- 1475 La Serena Way
- 1540 La Serena Way
- 342 N Las Flores Dr
- 381 Pajaro Ln
- 348 N Las Flores Dr
- 280 Pajaro Ln
- 265 Pajaro Ln
- 360 Pajaro Ln
- 270 N Las Flores Dr
- 391 Pajaro Ln
- 260 Pajaro Ln
- 1586 La Serena Way
- 325 Via Promesa
- 355 Via Promesa
- 350 N Las Flores Dr
- 380 Pajaro Ln
- 244 N Las Flores Dr
- 245 Pajaro Ln
Your Personal Tour Guide
Ask me questions while you tour the home.