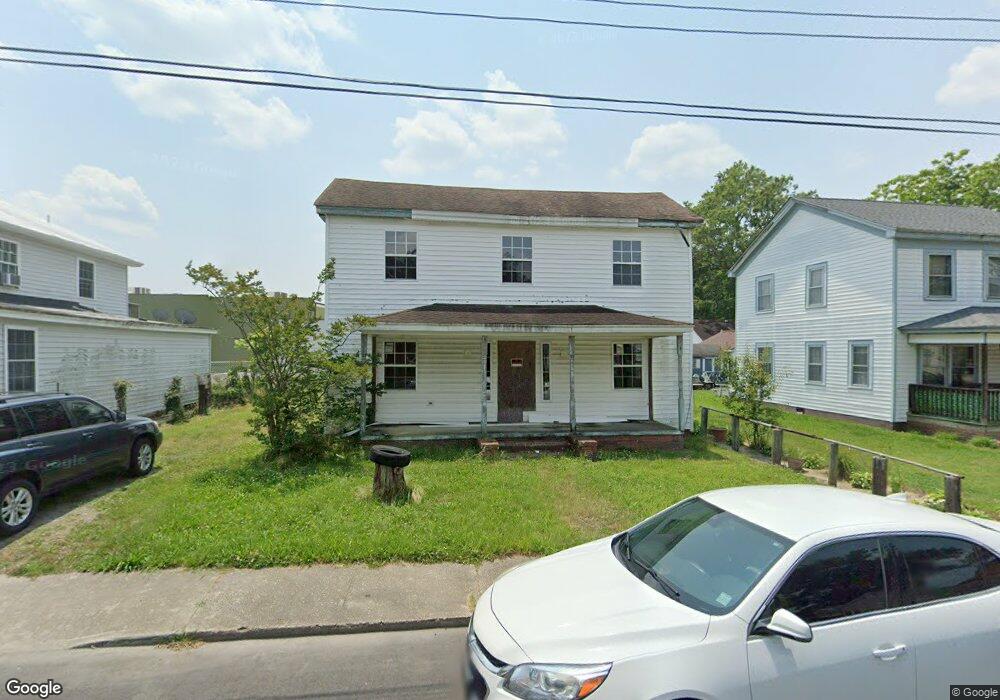
321 Pearl St Franklin, VA 23851
Estimated Value: $68,000 - $209,000
3
Beds
1
Bath
1,675
Sq Ft
$77/Sq Ft
Est. Value
About This Home
This home is located at 321 Pearl St, Franklin, VA 23851 and is currently estimated at $129,624, approximately $77 per square foot. 321 Pearl St is a home located in Franklin City with nearby schools including S.P. Morton Elementary School, Joseph P. King Jr. Middle School, and Franklin High School.
Ownership History
Date
Name
Owned For
Owner Type
Purchase Details
Closed on
Sep 17, 2023
Sold by
Baptist Church Of Franklin and Benton Valaida
Bought by
Smith Michael B and Harris Shannon S
Current Estimated Value
Home Financials for this Owner
Home Financials are based on the most recent Mortgage that was taken out on this home.
Original Mortgage
$20,800
Interest Rate
6.51%
Mortgage Type
New Conventional
Purchase Details
Closed on
Sep 7, 2011
Sold by
Glasser And Glasser Plc
Bought by
Bronco Federal Credit Union
Create a Home Valuation Report for This Property
The Home Valuation Report is an in-depth analysis detailing your home's value as well as a comparison with similar homes in the area
Home Values in the Area
Average Home Value in this Area
Purchase History
| Date | Buyer | Sale Price | Title Company |
|---|---|---|---|
| Smith Michael B | $200,000 | None Listed On Document | |
| Bronco Federal Credit Union | $36,500 | -- |
Source: Public Records
Mortgage History
| Date | Status | Borrower | Loan Amount |
|---|---|---|---|
| Previous Owner | Smith Michael B | $20,800 |
Source: Public Records
Tax History Compared to Growth
Tax History
| Year | Tax Paid | Tax Assessment Tax Assessment Total Assessment is a certain percentage of the fair market value that is determined by local assessors to be the total taxable value of land and additions on the property. | Land | Improvement |
|---|---|---|---|---|
| 2024 | $466 | $45,200 | $16,500 | $28,700 |
| 2023 | $340 | $33,000 | $16,500 | $16,500 |
| 2022 | $340 | $33,000 | $16,500 | $16,500 |
| 2021 | $320 | $31,100 | $15,000 | $16,100 |
| 2020 | $304 | $31,100 | $15,000 | $16,100 |
| 2019 | $304 | $30,700 | $15,000 | $15,700 |
| 2018 | $304 | $30,700 | $15,000 | $15,700 |
| 2017 | $424 | $42,800 | $14,300 | $28,500 |
| 2016 | $424 | $42,800 | $14,300 | $28,500 |
| 2015 | -- | $0 | $0 | $0 |
| 2014 | -- | $0 | $0 | $0 |
| 2013 | -- | $0 | $0 | $0 |
Source: Public Records
Map
Nearby Homes