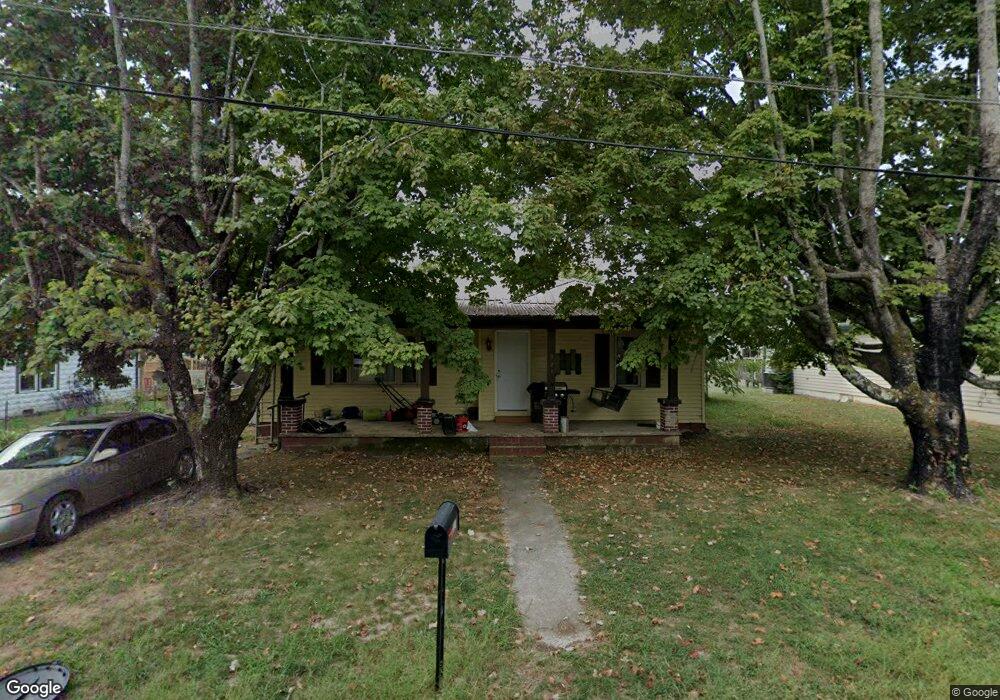
321 Pocahontas Ave Spring City, TN 37381
Estimated Value: $144,000 - $207,000
3
Beds
1
Bath
950
Sq Ft
$187/Sq Ft
Est. Value
About This Home
This home is located at 321 Pocahontas Ave, Spring City, TN 37381 and is currently estimated at $177,545, approximately $186 per square foot. 321 Pocahontas Ave is a home located in Rhea County with nearby schools including Rhea County High School, King Memorial Seventh Day Adve, and Spring City Christian Academy.
Ownership History
Date
Name
Owned For
Owner Type
Purchase Details
Closed on
Dec 28, 2023
Sold by
Masterson Loretta J and Masterson Daniel Nina
Bought by
Smith Dustyn
Current Estimated Value
Home Financials for this Owner
Home Financials are based on the most recent Mortgage that was taken out on this home.
Original Mortgage
$131,000
Outstanding Balance
$128,912
Interest Rate
7.44%
Mortgage Type
Construction
Estimated Equity
$48,633
Purchase Details
Closed on
Mar 2, 2013
Sold by
Williams Crystal
Bought by
Masterson Loretta J and Masterson Daniel Nina
Purchase Details
Closed on
Apr 9, 2010
Bought by
Williams Crystal
Purchase Details
Closed on
Apr 9, 2009
Sold by
Masterson Loretta J
Bought by
Williams Crystal
Purchase Details
Closed on
May 25, 2006
Bought by
Davenport Joyce
Purchase Details
Closed on
May 9, 1986
Bought by
Davenport Kenneth M and Davenport Joyce
Purchase Details
Closed on
Sep 18, 1979
Create a Home Valuation Report for This Property
The Home Valuation Report is an in-depth analysis detailing your home's value as well as a comparison with similar homes in the area
Home Values in the Area
Average Home Value in this Area
Purchase History
| Date | Buyer | Sale Price | Title Company |
|---|---|---|---|
| Smith Dustyn | $150,000 | None Listed On Document | |
| Masterson Loretta J | -- | -- | |
| Williams Crystal | $50,000 | -- | |
| Williams Crystal | $50,000 | -- | |
| Davenport Joyce | -- | -- | |
| Davenport Kenneth M | -- | -- | |
| -- | -- | -- |
Source: Public Records
Mortgage History
| Date | Status | Borrower | Loan Amount |
|---|---|---|---|
| Open | Smith Dustyn | $131,000 |
Source: Public Records
Tax History Compared to Growth
Tax History
| Year | Tax Paid | Tax Assessment Tax Assessment Total Assessment is a certain percentage of the fair market value that is determined by local assessors to be the total taxable value of land and additions on the property. | Land | Improvement |
|---|---|---|---|---|
| 2024 | -- | $36,275 | $5,925 | $30,350 |
| 2023 | $472 | $12,325 | $2,150 | $10,175 |
| 2022 | $278 | $12,325 | $2,150 | $10,175 |
| 2021 | $457 | $12,325 | $2,150 | $10,175 |
| 2020 | $415 | $12,325 | $2,150 | $10,175 |
| 2019 | $415 | $12,325 | $2,150 | $10,175 |
| 2018 | $345 | $10,425 | $1,000 | $9,425 |
| 2017 | $307 | $9,725 | $1,000 | $8,725 |
| 2016 | $307 | $9,725 | $1,000 | $8,725 |
| 2015 | $297 | $9,725 | $1,000 | $8,725 |
| 2014 | -- | $9,725 | $1,000 | $8,725 |
| 2013 | -- | $9,725 | $1,000 | $8,725 |
Source: Public Records
Map
Nearby Homes
- 676 W Rhea Ave
- 393 Pocahontas Ave
- 498 W Rhea Ave
- 229 Pierce St
- 000 Wassom Memorial Hwy
- 281 Ketchersid Ave
- 491 Piccadilly Ave
- 225 Spring St
- 229 Pierce Hill Rd
- 229 Pierce Hill St
- 0 Bayshore Dr Unit SPRING CITY TN 37381
- 107 &149 E Jackson Ave
- 107 E Jackson Ave
- 174 E Jackson Ave
- 277 Cemetery Rd
- 220 Hard Rector Ln
- 0 Beach Rd Unit RTC2986615
- 0 Beach Rd Unit 1508308
- Lot 33 Hinch St
- Lot 32 Hinch St
- 335 Pocahontas Ave
- 311 Pocahontas Ave
- 357 Pocahontas Ave
- 696 W Rhea Ave
- 684 W Rhea Ave
- 141 Short St
- 708 W Rhea Ave
- 322 Pocahontas Ave
- 363 Pocahontas Ave
- 310 Pocahontas Ave
- 344 Pocahontas Ave
- 660 W Rhea Ave
- 187 Short St
- 360 Pocahontas Ave
- 381 Pocahontas Ave
- 156 Short St
- 754 W Rhea Ave
- 126 Short St
- 380 Pocahontas Ave
- 272 Pocahontas Ave