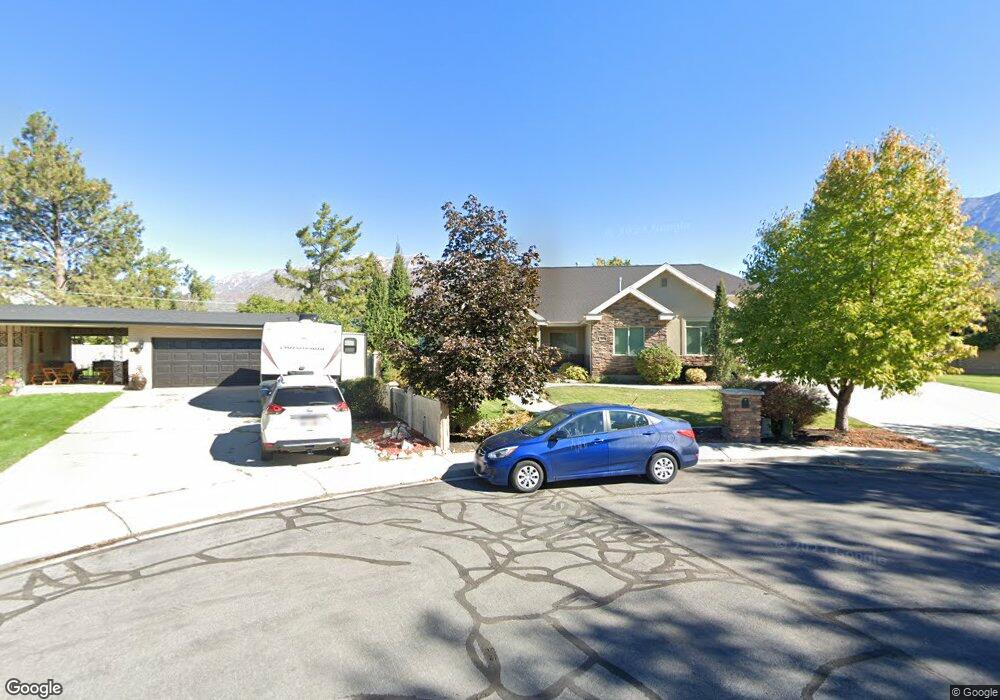
321 S 530 E Orem, UT 84097
SCERA NeighborhoodEstimated Value: $943,000 - $1,258,617
3
Beds
5
Baths
2,650
Sq Ft
$413/Sq Ft
Est. Value
About This Home
This home is located at 321 S 530 E, Orem, UT 84097 and is currently estimated at $1,095,206, approximately $413 per square foot. 321 S 530 E is a home with nearby schools including Centennial Elementary, Lakeridge Jr High School, and Orem High School.
Ownership History
Date
Name
Owned For
Owner Type
Purchase Details
Closed on
Jun 8, 2023
Sold by
Mitchell David Spencer
Bought by
Blanchard Perin and Blanchard Ashley
Current Estimated Value
Purchase Details
Closed on
Nov 17, 2015
Sold by
Mitchell Steven K
Bought by
Mitchell Steven L and Steven Trust
Purchase Details
Closed on
Jun 25, 2014
Sold by
Barr Kevin M O and Barr Valerie M O
Bought by
Mitchell Steven K
Purchase Details
Closed on
Aug 14, 2007
Sold by
Crowley Vernal and Crowley Dorothy
Bought by
Obarr Kevin M and Obarr Valerie M
Create a Home Valuation Report for This Property
The Home Valuation Report is an in-depth analysis detailing your home's value as well as a comparison with similar homes in the area
Home Values in the Area
Average Home Value in this Area
Purchase History
| Date | Buyer | Sale Price | Title Company |
|---|---|---|---|
| Blanchard Perin | -- | Inwest Title | |
| Mitchell Steven L | -- | None Available | |
| Mitchell Steven K | -- | Bartlett Title Ins Agen | |
| Obarr Kevin M | -- | First American Orem |
Source: Public Records
Tax History
| Year | Tax Paid | Tax Assessment Tax Assessment Total Assessment is a certain percentage of the fair market value that is determined by local assessors to be the total taxable value of land and additions on the property. | Land | Improvement |
|---|---|---|---|---|
| 2025 | $4,252 | $613,140 | -- | -- |
| 2024 | $4,252 | $519,970 | $0 | $0 |
| 2023 | $3,753 | $493,295 | $0 | $0 |
| 2022 | $3,491 | $444,455 | $0 | $0 |
| 2021 | $3,336 | $643,400 | $156,100 | $487,300 |
| 2020 | $3,179 | $602,600 | $124,900 | $477,700 |
| 2019 | $3,015 | $594,300 | $116,600 | $477,700 |
| 2018 | $3,043 | $573,100 | $112,400 | $460,700 |
| 2017 | $2,893 | $291,885 | $0 | $0 |
| 2016 | $2,980 | $277,200 | $0 | $0 |
| 2015 | $1,769 | $155,595 | $0 | $0 |
Source: Public Records
Map
Nearby Homes
Your Personal Tour Guide
Ask me questions while you tour the home.