Estimated Value: $1,035,000 - $1,139,000
4
Beds
3
Baths
1,201
Sq Ft
$911/Sq Ft
Est. Value
About This Home
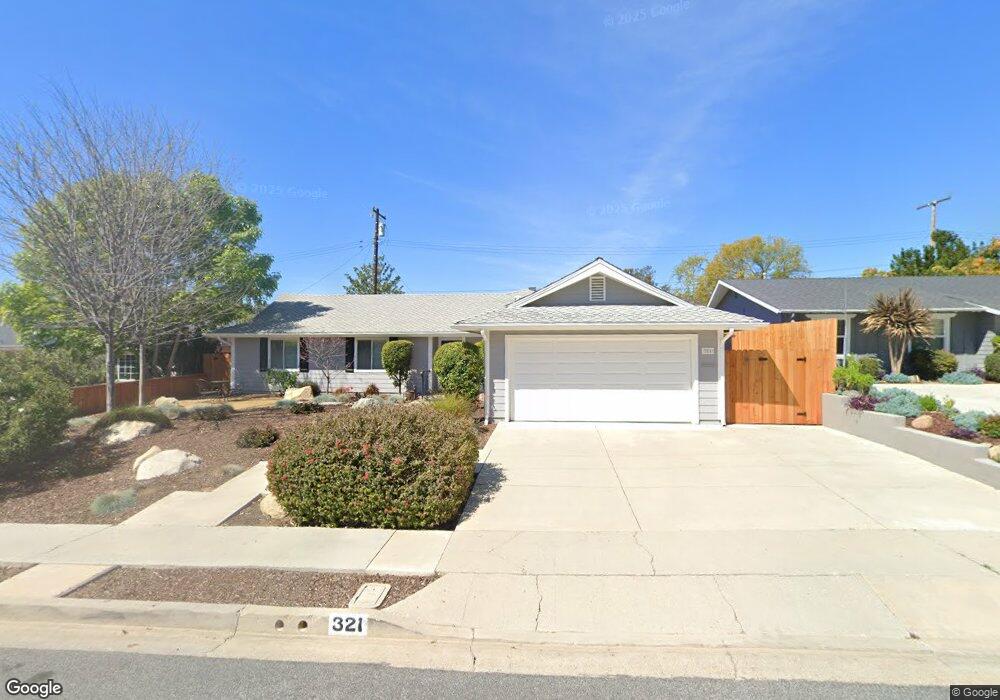
This home is located at 321 S Carrillo Rd, Ojai, CA 93023 and is currently estimated at $1,093,597, approximately $910 per square foot. 321 S Carrillo Rd is a home located in Ventura County with nearby schools including Mira Monte Elementary School, Meiners Oaks Elementary School, and Matilija Junior High.
Ownership History
Date
Name
Owned For
Owner Type
Purchase Details
Closed on
Jul 13, 2017
Sold by
Nielsen Joyce
Bought by
Nielsen Joyce Elaine
Current Estimated Value
Purchase Details
Closed on
Dec 2, 2016
Sold by
King Michael A and King John Andrew
Bought by
Nielsen Joyce
Home Financials for this Owner
Home Financials are based on the most recent Mortgage that was taken out on this home.
Original Mortgage
$400,000
Interest Rate
4.08%
Mortgage Type
New Conventional
Purchase Details
Closed on
Aug 17, 2009
Sold by
King John A and King Martha R
Bought by
King John A and King Martha R
Purchase Details
Closed on
Jul 29, 1997
Sold by
Howard Radding and Howard Renee M
Bought by
King John A and King Martha R
Home Financials for this Owner
Home Financials are based on the most recent Mortgage that was taken out on this home.
Original Mortgage
$154,000
Interest Rate
7.45%
Create a Home Valuation Report for This Property
The Home Valuation Report is an in-depth analysis detailing your home's value as well as a comparison with similar homes in the area
Home Values in the Area
Average Home Value in this Area
Purchase History
| Date | Buyer | Sale Price | Title Company |
|---|---|---|---|
| Nielsen Joyce Elaine | -- | None Available | |
| Nielsen Joyce | $675,000 | None Available | |
| King John A | -- | None Available | |
| King John A | $220,000 | First American Title Ins Co |
Source: Public Records
Mortgage History
| Date | Status | Borrower | Loan Amount |
|---|---|---|---|
| Previous Owner | Nielsen Joyce | $400,000 | |
| Previous Owner | King John A | $154,000 |
Source: Public Records
Tax History
| Year | Tax Paid | Tax Assessment Tax Assessment Total Assessment is a certain percentage of the fair market value that is determined by local assessors to be the total taxable value of land and additions on the property. | Land | Improvement |
|---|---|---|---|---|
| 2025 | $9,123 | $783,389 | $509,496 | $273,893 |
| 2024 | $9,123 | $768,029 | $499,506 | $268,523 |
| 2023 | $8,804 | $752,970 | $489,712 | $263,258 |
| 2022 | $8,675 | $738,206 | $480,109 | $258,097 |
| 2021 | $8,632 | $723,732 | $470,695 | $253,037 |
| 2020 | $8,420 | $716,313 | $465,869 | $250,444 |
| 2019 | $8,170 | $702,269 | $456,735 | $245,534 |
| 2018 | $8,099 | $688,500 | $447,780 | $240,720 |
| 2017 | $4,440 | $340,564 | $118,689 | $221,875 |
| 2016 | $4,314 | $333,887 | $116,362 | $217,525 |
| 2015 | $4,277 | $328,873 | $114,615 | $214,258 |
| 2014 | $4,090 | $322,433 | $112,371 | $210,062 |
Source: Public Records
Map
Nearby Homes
- 329 S Carrillo Rd
- 1318 La Paz Dr
- 203 N Carrillo Rd Unit B
- 203 N Carrillo Rd Unit B
- 202 N Carrillo Rd Unit E
- 1090 Cuyama Rd
- 11966 N Ventura Ave
- 1202 Loma Dr Unit 41
- 1202 Loma Dr Unit 46
- 1130 Rancho Dr
- 1885 Maricopa Hwy Unit 1
- 205 S Lomita Ave
- 0 S Pueblo Ave
- 203 Foothill Rd
- 1131 Rancho Dr
- 1075 Loma Dr Unit 66
- 1075 Loma Dr Unit 7
- 1075 Loma Dr Unit 47
- 411 S Padre Juan Ave
- 171 S Pueblo Ave
- 321 S Carrillo Rd
- 321 S Carillo Rd
- 325 S Carrillo Rd
- 317 S Carrillo Rd
- 322 Vallerio Ave
- 322 Valle Rio Ave
- 326 Vallerio Ave
- 318 Vallerio Ave
- 313 S Carrillo Rd
- 330 Vallerio Ave
- 314 Vallerio Ave
- 326 S Carrillo Rd
- 322 S Carrillo Rd
- 330 S Carrillo Rd
- 309 S Carrillo Rd
- 318 S Carrillo Rd
- 314 S Carillo Rd
- 310 Vallerio Ave
- 334 S Carrillo Rd
- 401 S Carrillo Rd
Your Personal Tour Guide
Ask me questions while you tour the home.