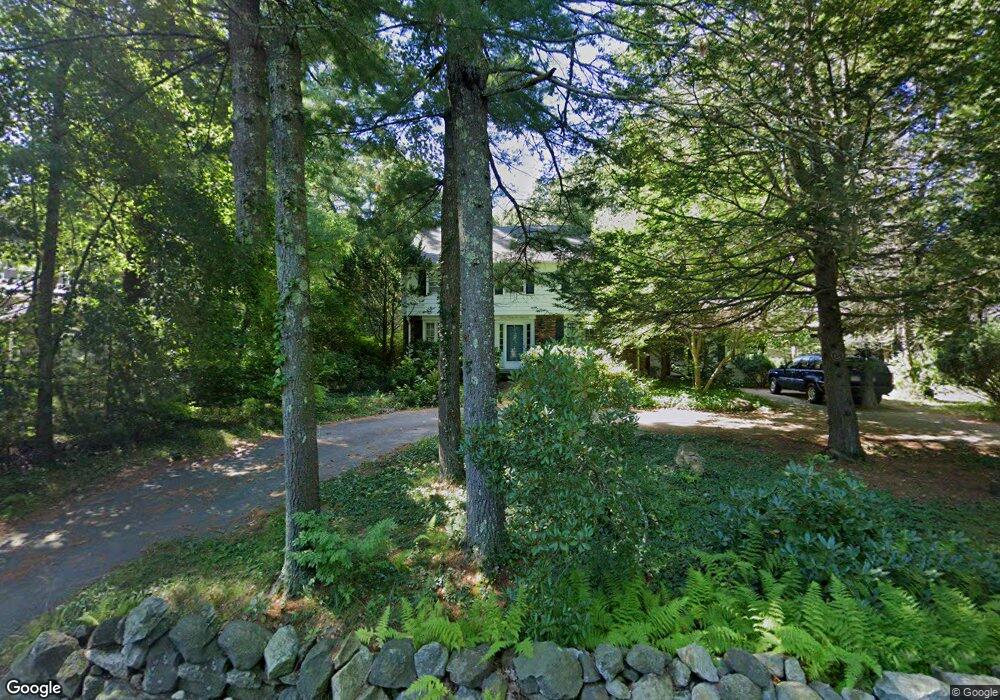
321 Salem St Andover, MA 01810
Estimated Value: $902,000 - $1,008,000
4
Beds
2
Baths
2,778
Sq Ft
$349/Sq Ft
Est. Value
About This Home
This home is located at 321 Salem St, Andover, MA 01810 and is currently estimated at $969,109, approximately $348 per square foot. 321 Salem St is a home located in Essex County with nearby schools including Bancroft Elementary School, Doherty Middle School, and Andover High School.
Ownership History
Date
Name
Owned For
Owner Type
Purchase Details
Closed on
Dec 20, 2024
Sold by
Arz Realty Llc
Bought by
Lavigne Derek and Madden Michaela
Current Estimated Value
Home Financials for this Owner
Home Financials are based on the most recent Mortgage that was taken out on this home.
Original Mortgage
$742,000
Outstanding Balance
$735,498
Interest Rate
6.79%
Mortgage Type
Purchase Money Mortgage
Estimated Equity
$233,611
Purchase Details
Closed on
Sep 26, 2023
Sold by
Dagmar Jacobson Ret and Jacobson
Bought by
Arz Realty Llc
Purchase Details
Closed on
Mar 6, 2017
Sold by
Jacobson Dagmar
Bought by
Dagmar Jacobson Ret and Jacobson
Purchase Details
Closed on
Sep 1, 1988
Sold by
Luistro Frank M
Bought by
Jacobson Dagma Mjos
Create a Home Valuation Report for This Property
The Home Valuation Report is an in-depth analysis detailing your home's value as well as a comparison with similar homes in the area
Home Values in the Area
Average Home Value in this Area
Purchase History
| Date | Buyer | Sale Price | Title Company |
|---|---|---|---|
| Lavigne Derek | $927,500 | None Available | |
| Lavigne Derek | $927,500 | None Available | |
| Arz Realty Llc | $605,000 | None Available | |
| Arz Realty Llc | $605,000 | None Available | |
| Dagmar Jacobson Ret | -- | -- | |
| Dagmar Jacobson Ret | -- | -- | |
| Jacobson Dagma Mjos | $278,500 | -- |
Source: Public Records
Mortgage History
| Date | Status | Borrower | Loan Amount |
|---|---|---|---|
| Open | Lavigne Derek | $742,000 | |
| Closed | Lavigne Derek | $742,000 | |
| Previous Owner | Jacobson Dagma Mjos | $100,000 |
Source: Public Records
Tax History Compared to Growth
Tax History
| Year | Tax Paid | Tax Assessment Tax Assessment Total Assessment is a certain percentage of the fair market value that is determined by local assessors to be the total taxable value of land and additions on the property. | Land | Improvement |
|---|---|---|---|---|
| 2024 | $10,953 | $850,400 | $509,600 | $340,800 |
| 2023 | $10,458 | $765,600 | $459,100 | $306,500 |
| 2022 | $9,805 | $671,600 | $399,400 | $272,200 |
| 2021 | $9,365 | $612,500 | $363,300 | $249,200 |
| 2020 | $8,979 | $598,200 | $354,600 | $243,600 |
| 2019 | $8,890 | $582,200 | $344,100 | $238,100 |
| 2018 | $8,589 | $549,200 | $331,000 | $218,200 |
| 2017 | $8,209 | $540,800 | $324,500 | $216,300 |
| 2016 | $8,015 | $540,800 | $324,500 | $216,300 |
| 2015 | $7,714 | $515,300 | $311,900 | $203,400 |
Source: Public Records
Map
Nearby Homes
- 2 Tamys Ln
- 8 Athena Cir
- 21 Rocky Hill Rd
- 17 Linda Rd
- 133B Salem
- 18 Boston Rd
- 331 S Main St
- 11 Gould Rd
- 7 Sullivan St
- 104 Salem St
- 4 Buchan Rd
- 40 Ballardvale Rd
- 50 Hidden Rd
- 40 Colonial Dr Unit 8
- 20 Colonial Dr Unit 3
- 2 Clover Cir
- 56 Sunset Rock Rd
- 1 Colonial Dr Unit C1-6
- 1 Colonial Dr Unit B1-8
- 53 Salem St
- 315 Salem St
- 323 Salem St
- 331 Salem St
- 27 Wethersfield Dr
- 310 Salem St
- 332 Salem St
- 25 Wethersfield Dr
- 337 Salem St
- 23 Wethersfield Dr
- 304 Salem St
- 3 Wagon Wheel Rd
- 338 Salem St
- 21 Wethersfield Dr
- 5 Wagon Wheel Rd
- 26 Wethersfield Dr
- 339 Salem St
- 24 Wethersfield Dr
- 19 Wethersfield Dr
- 340 Salem St
- 300 Salem St