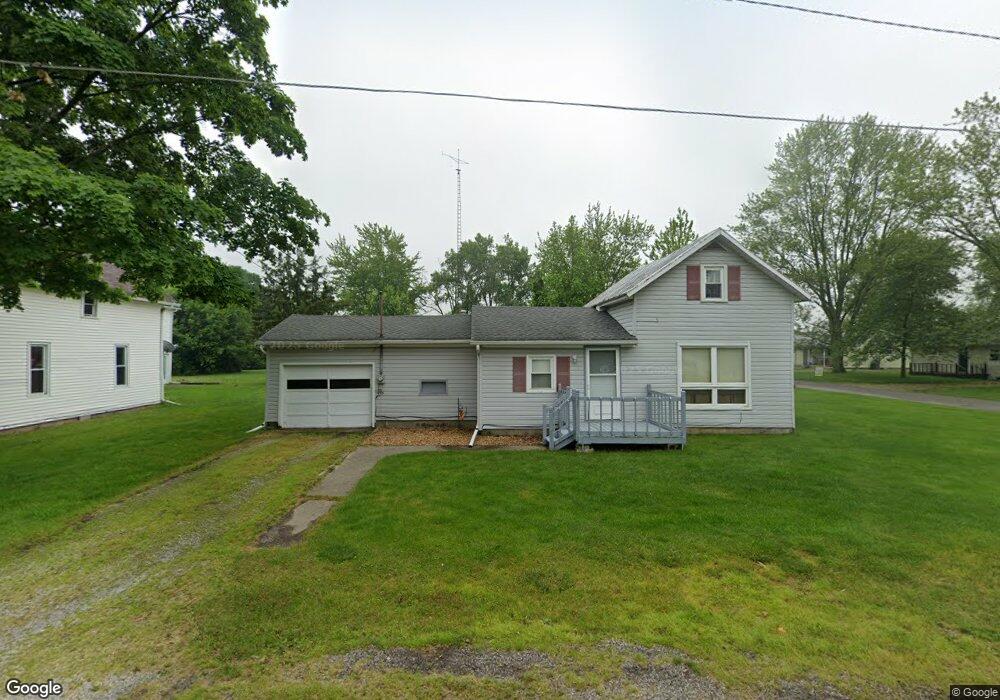
321 Smith St Holgate, OH 43527
Estimated Value: $65,000 - $94,000
3
Beds
1
Bath
1,170
Sq Ft
$70/Sq Ft
Est. Value
About This Home
This home is located at 321 Smith St, Holgate, OH 43527 and is currently estimated at $82,032, approximately $70 per square foot. 321 Smith St is a home located in Henry County with nearby schools including Holgate Elementary School and Holgate High School.
Ownership History
Date
Name
Owned For
Owner Type
Purchase Details
Closed on
Jun 4, 2020
Sold by
Del Rae Rentals Ltd
Bought by
Brown Shelly
Current Estimated Value
Home Financials for this Owner
Home Financials are based on the most recent Mortgage that was taken out on this home.
Original Mortgage
$44,000
Outstanding Balance
$39,003
Interest Rate
3.2%
Mortgage Type
Future Advance Clause Open End Mortgage
Estimated Equity
$43,029
Purchase Details
Closed on
May 9, 2005
Sold by
Fifer Ralph H and Fifer Delorus J
Bought by
Del Rae Rentals Ltd
Purchase Details
Closed on
Aug 11, 2003
Sold by
Killion Valerie J
Bought by
Fifer Ralph H and Fifer Delorus J
Home Financials for this Owner
Home Financials are based on the most recent Mortgage that was taken out on this home.
Original Mortgage
$40,000
Interest Rate
5.47%
Mortgage Type
Unknown
Purchase Details
Closed on
Jun 5, 2000
Sold by
Junge James M
Bought by
Ux Harold Killion Et
Create a Home Valuation Report for This Property
The Home Valuation Report is an in-depth analysis detailing your home's value as well as a comparison with similar homes in the area
Purchase History
| Date | Buyer | Sale Price | Title Company |
|---|---|---|---|
| Brown Shelly | $55,000 | None Available | |
| Del Rae Rentals Ltd | -- | -- | |
| Fifer Ralph H | $45,000 | -- | |
| Ux Harold Killion Et | $42,000 | -- |
Source: Public Records
Mortgage History
| Date | Status | Borrower | Loan Amount |
|---|---|---|---|
| Open | Brown Shelly | $44,000 | |
| Previous Owner | Fifer Ralph H | $40,000 |
Source: Public Records
Tax History
| Year | Tax Paid | Tax Assessment Tax Assessment Total Assessment is a certain percentage of the fair market value that is determined by local assessors to be the total taxable value of land and additions on the property. | Land | Improvement |
|---|---|---|---|---|
| 2024 | $692 | $17,680 | $2,960 | $14,720 |
| 2023 | $697 | $17,680 | $2,960 | $14,720 |
| 2022 | $663 | $26,580 | $5,440 | $21,140 |
| 2021 | $673 | $13,290 | $2,720 | $10,570 |
| 2020 | $719 | $13,290 | $2,720 | $10,570 |
| 2019 | $657 | $12,660 | $2,590 | $10,070 |
| 2018 | $664 | $12,660 | $2,590 | $10,070 |
| 2017 | $641 | $12,660 | $2,590 | $10,070 |
| 2016 | $583 | $11,710 | $2,590 | $9,120 |
| 2015 | $554 | $11,710 | $2,590 | $9,120 |
| 2014 | $627 | $11,710 | $2,590 | $9,120 |
| 2013 | $627 | $13,070 | $2,590 | $10,480 |
Source: Public Records
Map
Nearby Homes
- 215 Cherry St
- 324 Marion Ave
- 413 Kaufman St
- 418 N Wilhelm St
- 315 Pittsburgh Ave
- 416 Railway Ave
- 307/308 Railway Ave
- 423 Joe E Brown Ave
- H011 County Road 17
- 782 Walnut St
- 951 Walnut St
- 9990 State Route 281
- 415 E Hubbard St
- E670 County Road 8b
- 104 W High St
- 29024 Ayersville Pleasant Bend Rd
- 29235 Bowman Rd
- 205 Hickory Dr
- 0 County Road 424
- 150 Wayne Park Dr
- 317 Smith St
- 309 S Theresa St
- 403 Smith St
- 316 N Theresa St
- 316 N Theresa St
- 322 Smith St
- 304 S Brayer St
- 312 S Brayer St
- 222 S Therese St
- 321 S Theresa St
- 222 S Theresa St
- 304 Smith St
- 320 S Theresa St
- 322 S Brayer St
- 216 S Theresa St
- 221 S Theresa St
- 421 Smith St
- 216 S Brayer St
- 315 S Upton St
- 416 Smith St
Your Personal Tour Guide
Ask me questions while you tour the home.