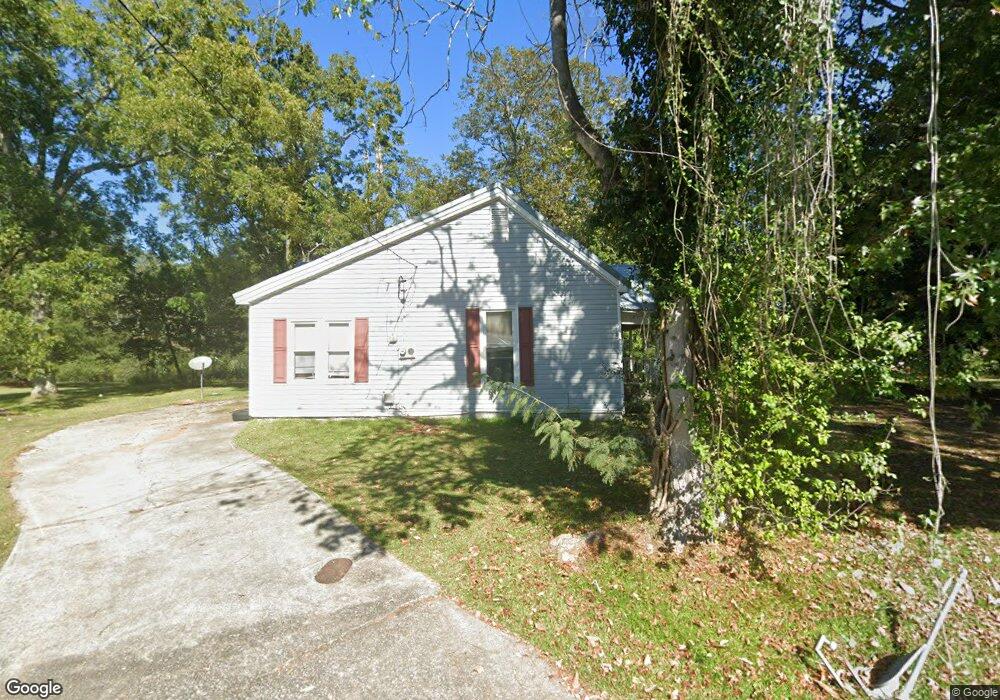
321 Tallapoosa St W Bremen, GA 30110
Estimated Value: $243,000 - $546,000
3
Beds
1
Bath
1,424
Sq Ft
$256/Sq Ft
Est. Value
About This Home
This home is located at 321 Tallapoosa St W, Bremen, GA 30110 and is currently estimated at $364,821, approximately $256 per square foot. 321 Tallapoosa St W is a home located in Haralson County with nearby schools including Jones Elementary School, Bremen 4th & 5th Grade Academy, and Bremen Middle School.
Ownership History
Date
Name
Owned For
Owner Type
Purchase Details
Closed on
Dec 20, 2012
Sold by
Atlanta Investment Realty
Bought by
Marnell Properties Llc
Current Estimated Value
Home Financials for this Owner
Home Financials are based on the most recent Mortgage that was taken out on this home.
Original Mortgage
$204,277
Interest Rate
3.35%
Mortgage Type
Commercial
Purchase Details
Closed on
Mar 29, 2007
Sold by
Rush Jason D
Bought by
Atlanta Investment Realty Llc
Home Financials for this Owner
Home Financials are based on the most recent Mortgage that was taken out on this home.
Original Mortgage
$264,007
Interest Rate
6.15%
Mortgage Type
Commercial
Purchase Details
Closed on
Jun 25, 2004
Sold by
Prichard William Harold and Danny Lee
Bought by
Rush Jason D
Purchase Details
Closed on
Nov 20, 1993
Bought by
Prichard William Harold and Danny Lee
Purchase Details
Closed on
Jan 1, 1984
Bought by
Wright
Create a Home Valuation Report for This Property
The Home Valuation Report is an in-depth analysis detailing your home's value as well as a comparison with similar homes in the area
Home Values in the Area
Average Home Value in this Area
Purchase History
| Date | Buyer | Sale Price | Title Company |
|---|---|---|---|
| Marnell Properties Llc | $200,000 | -- | |
| Atlanta Investment Realty Llc | $260,000 | -- | |
| Atlanta Investment Realty Llc | -- | -- | |
| Rush Jason D | $215,000 | -- | |
| Prichard William Harold | -- | -- | |
| Wright | -- | -- |
Source: Public Records
Mortgage History
| Date | Status | Borrower | Loan Amount |
|---|---|---|---|
| Closed | Marnell Properties Llc | $204,277 | |
| Previous Owner | Atlanta Investment Realty Llc | $264,007 |
Source: Public Records
Tax History Compared to Growth
Tax History
| Year | Tax Paid | Tax Assessment Tax Assessment Total Assessment is a certain percentage of the fair market value that is determined by local assessors to be the total taxable value of land and additions on the property. | Land | Improvement |
|---|---|---|---|---|
| 2024 | $3,472 | $123,629 | $11,966 | $111,663 |
| 2023 | $4,245 | $141,198 | $11,966 | $129,232 |
| 2022 | $1,089 | $112,984 | $11,966 | $101,018 |
| 2021 | $1,088 | $107,724 | $11,966 | $95,758 |
| 2020 | $1,114 | $109,719 | $11,966 | $97,753 |
| 2019 | $2,749 | $86,660 | $10,599 | $76,061 |
| 2018 | $922 | $86,660 | $10,599 | $76,061 |
| 2017 | $1,026 | $86,660 | $11,966 | $74,694 |
| 2016 | $1,014 | $81,635 | $11,966 | $69,669 |
| 2015 | $1,016 | $81,481 | $11,966 | $69,515 |
| 2014 | $1,328 | $83,071 | $11,966 | $71,104 |
Source: Public Records
Map
Nearby Homes
- 0 Sewell Rd Unit 10624236
- 0 Sewell Rd Unit 7665305
- 6315 Highway 78
- 522 Atlantic Ave
- 330 Kensington Cir
- 225 Edwards St
- 311 Kensington Cir
- 273 Sewell Rd
- 111 Bryan St W
- 223 Gordon St
- 735 Tallapoosa St W
- 4000 Highway 78
- 4711 Highway 78 Unit 235
- 4711 Highway 78
- 107 Marchman St
- 0 Mt Zion St Unit 7399245
- 707 Mill Stone Way
- 422 Oak St
- 201 Georgia Ave S
- 56 Sewell Rd
- 317 Tallapoosa St W
- 111 Sewell Rd
- 108 Sewell Rd
- 110 Sewell Rd
- 311 Tallapoosa St W
- 315 Tallapoosa St W
- 91 Sewell Rd
- 109 Hamilton St
- 431 Tallapoosa St W
- 309 Tallapoosa St W
- 0 Sewell Rd
- 0 Sewell Rd Unit 8812884
- 0 Sewell Rd Unit 8756769
- 0 Sewell Rd Unit 8049930
- 0 Sewell Rd Unit 7394961
- 0 Sewell Rd Unit 3098559
- 0 Sewell Rd Unit 7203845
- 0 Sewell Rd Unit 7200348
- 0 Sewell Rd Unit 7052882