Estimated Value: $793,000 - $894,000
4
Beds
3
Baths
2,501
Sq Ft
$343/Sq Ft
Est. Value
About This Home
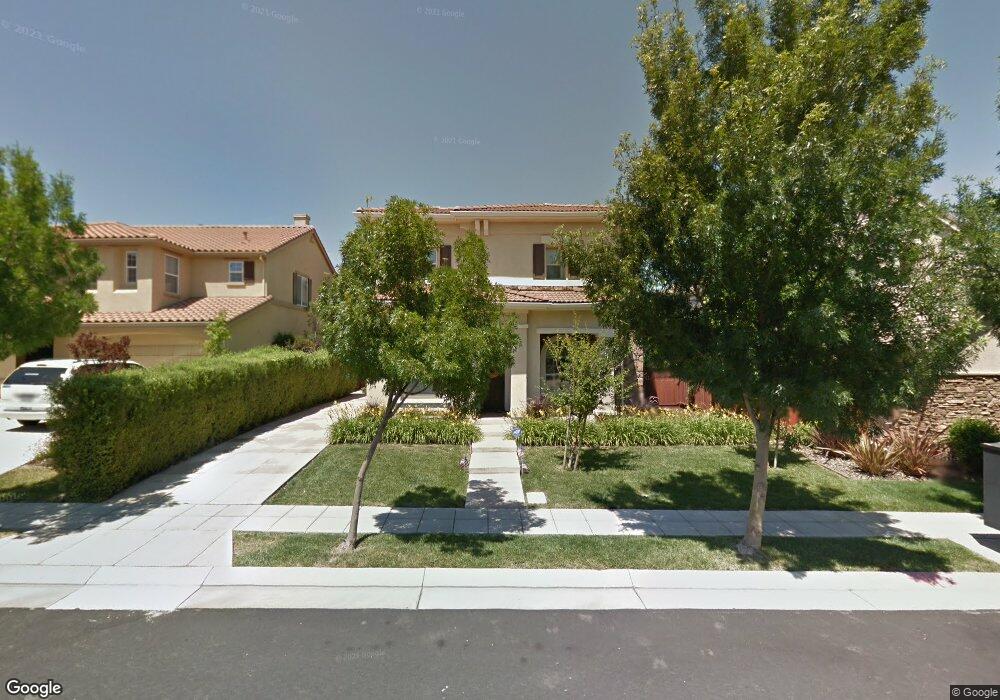
This home is located at 321 W Verano Way, Tracy, CA 95391 and is currently estimated at $858,575, approximately $343 per square foot. 321 W Verano Way is a home located in San Joaquin County with nearby schools including Bethany Elementary School, Altamont Elementary School, and Mountain House High School.
Ownership History
Date
Name
Owned For
Owner Type
Purchase Details
Closed on
Feb 3, 2010
Sold by
Aurora Loan Services Llc
Bought by
Chen Andy Guec
Current Estimated Value
Purchase Details
Closed on
Sep 18, 2009
Sold by
Owens Wendell M
Bought by
Aurora Loan Services Llc
Purchase Details
Closed on
Sep 22, 2005
Sold by
Lennar Homes Of California Inc
Bought by
Owens Wendell M
Home Financials for this Owner
Home Financials are based on the most recent Mortgage that was taken out on this home.
Original Mortgage
$133,450
Interest Rate
6.25%
Mortgage Type
Stand Alone Second
Purchase Details
Closed on
Jun 21, 2005
Sold by
Lpc One Development Partners Llc
Bought by
Lennar Homes Of California Inc
Purchase Details
Closed on
Jun 18, 2005
Sold by
Trimark Communities Llc
Bought by
Lennar Homes Of California Inc
Create a Home Valuation Report for This Property
The Home Valuation Report is an in-depth analysis detailing your home's value as well as a comparison with similar homes in the area
Home Values in the Area
Average Home Value in this Area
Purchase History
| Date | Buyer | Sale Price | Title Company |
|---|---|---|---|
| Chen Andy Guec | $301,000 | Chicago Title Company | |
| Aurora Loan Services Llc | $562,894 | Servicelink | |
| Owens Wendell M | $654,500 | North Amer Title Co | |
| Lennar Homes Of California Inc | -- | North Amer Title Co | |
| Lennar Homes Of California Inc | -- | North Amer Title Co |
Source: Public Records
Mortgage History
| Date | Status | Borrower | Loan Amount |
|---|---|---|---|
| Previous Owner | Owens Wendell M | $133,450 |
Source: Public Records
Tax History Compared to Growth
Tax History
| Year | Tax Paid | Tax Assessment Tax Assessment Total Assessment is a certain percentage of the fair market value that is determined by local assessors to be the total taxable value of land and additions on the property. | Land | Improvement |
|---|---|---|---|---|
| 2025 | $7,951 | $388,518 | $96,805 | $291,713 |
| 2024 | $7,744 | $380,901 | $94,907 | $285,994 |
| 2023 | $7,602 | $373,434 | $93,047 | $280,387 |
| 2022 | $7,425 | $366,113 | $91,223 | $274,890 |
| 2021 | $7,349 | $358,935 | $89,435 | $269,500 |
| 2020 | $7,251 | $355,255 | $88,518 | $266,737 |
| 2019 | $7,151 | $348,290 | $86,783 | $261,507 |
| 2018 | $7,482 | $341,462 | $85,082 | $256,380 |
| 2017 | $6,929 | $334,767 | $83,414 | $251,353 |
| 2016 | $6,661 | $328,205 | $81,779 | $246,426 |
| 2014 | $6,447 | $316,947 | $78,974 | $237,973 |
Source: Public Records
Map
Nearby Homes
- 202 W Fauna Ave
- 1137 N Bianca Ln
- 948 S Blake St
- 261 W Prosperidad Way
- 1001 S Shields Ave
- 356 S Paraiso Way
- 1025 S Fowler Ln
- 589 W Huntington Ave
- 607 W Huntington Ave
- 155 E Heritage Dr
- 575 W Strauss Dr
- 188 S Pacifico St
- 322 S Central Pkwy
- 153 W Luna Loca Ln
- 161 W Luna Loca Ln
- 233 S Yucatan Place
- 111 Winter Ln
- 1070 S Atwood Ct
- 274 W Gaspara Dr Unit 236
- 292 W Lucita Way
- 345 W Verano Way
- 309 W Verano Way
- 324 W Heritage Dr
- 297 W Verano Way
- 369 W Verano Way
- 342 W Heritage Dr
- 368 W Heritage Dr
- 292 W Heritage Dr
- 255 W Verano Way
- 332 W Verano Way
- 316 W Verano Way
- 397 W Verano Way
- 354 W Verano Way
- 302 W Verano Way
- 396 W Heritage Dr
- 260 W Heritage Dr
- 656 S Vecindad St
- 286 W Verano Way
- 233 W Verano Way
- 228 W Heritage Dr