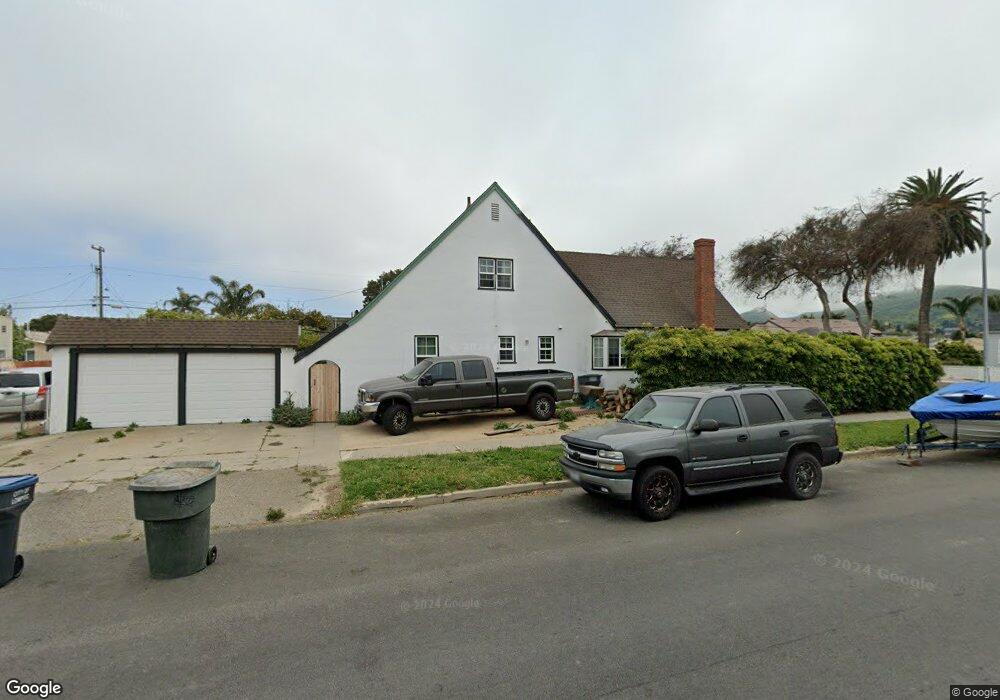
321 W Walnut Ave Lompoc, CA 93436
Estimated Value: $559,000 - $712,000
5
Beds
2
Baths
2,275
Sq Ft
$293/Sq Ft
Est. Value
About This Home
This home is located at 321 W Walnut Ave, Lompoc, CA 93436 and is currently estimated at $667,474, approximately $293 per square foot. 321 W Walnut Ave is a home located in Santa Barbara County with nearby schools including Arthur Hapgood Elementary School, Lompoc Valley Middle School, and Lompoc High School.
Ownership History
Date
Name
Owned For
Owner Type
Purchase Details
Closed on
Jun 21, 2023
Sold by
Dixon Michelle Ann and Rojas Pedro
Bought by
Dixon Michelle and Rojas Pedro
Current Estimated Value
Home Financials for this Owner
Home Financials are based on the most recent Mortgage that was taken out on this home.
Original Mortgage
$506,308
Outstanding Balance
$491,142
Interest Rate
6.39%
Mortgage Type
FHA
Estimated Equity
$176,332
Purchase Details
Closed on
Feb 15, 2022
Sold by
Perry W Martin And Alyce C Martin Trust
Bought by
Dixon Michelle Ann and Rojas Pedro
Home Financials for this Owner
Home Financials are based on the most recent Mortgage that was taken out on this home.
Original Mortgage
$356,125
Interest Rate
3.69%
Mortgage Type
FHA
Purchase Details
Closed on
Apr 14, 1999
Sold by
Martin Perry W and Martin Alyce C
Bought by
Martin Perry W and Martin Alyce C
Create a Home Valuation Report for This Property
The Home Valuation Report is an in-depth analysis detailing your home's value as well as a comparison with similar homes in the area
Home Values in the Area
Average Home Value in this Area
Purchase History
| Date | Buyer | Sale Price | Title Company |
|---|---|---|---|
| Dixon Michelle | -- | Title Connect | |
| Dixon Michelle Ann | $600,000 | First American Title | |
| Martin Perry W | -- | -- | |
| Martin Perry W | -- | -- |
Source: Public Records
Mortgage History
| Date | Status | Borrower | Loan Amount |
|---|---|---|---|
| Open | Dixon Michelle | $506,308 | |
| Previous Owner | Dixon Michelle Ann | $356,125 |
Source: Public Records
Tax History
| Year | Tax Paid | Tax Assessment Tax Assessment Total Assessment is a certain percentage of the fair market value that is determined by local assessors to be the total taxable value of land and additions on the property. | Land | Improvement |
|---|---|---|---|---|
| 2025 | $6,914 | $636,724 | $212,241 | $424,483 |
| 2023 | $6,914 | $600,000 | $200,000 | $400,000 |
| 2022 | $5,899 | $520,200 | $163,200 | $357,000 |
| 2021 | $967 | $86,268 | $17,886 | $68,382 |
| 2020 | $956 | $85,384 | $17,703 | $67,681 |
| 2019 | $938 | $83,710 | $17,356 | $66,354 |
| 2018 | $921 | $82,069 | $17,016 | $65,053 |
| 2017 | $903 | $80,461 | $16,683 | $63,778 |
| 2016 | $885 | $78,884 | $16,356 | $62,528 |
| 2014 | $863 | $76,179 | $15,796 | $60,383 |
Source: Public Records
Map
Nearby Homes
- 217 N M St
- 117 S I St
- 510 N I St
- 526 N L St
- 215 S H St
- 801, 851 California 246
- 533 N G St
- 531 N O St
- 1011 W Walnut Ave
- 205 S E St
- 425 S J St
- 23 Village Circle Dr
- 267 Village Circle Dr
- 413 S O Place
- 1410 W Apricot Ave
- 319 S B St
- 1408 W Walnut Ave
- 1355 Crown Cir
- 1311 W Cypress Ave Unit B2
- 610 E Pine Ave Unit 10
Your Personal Tour Guide
Ask me questions while you tour the home.