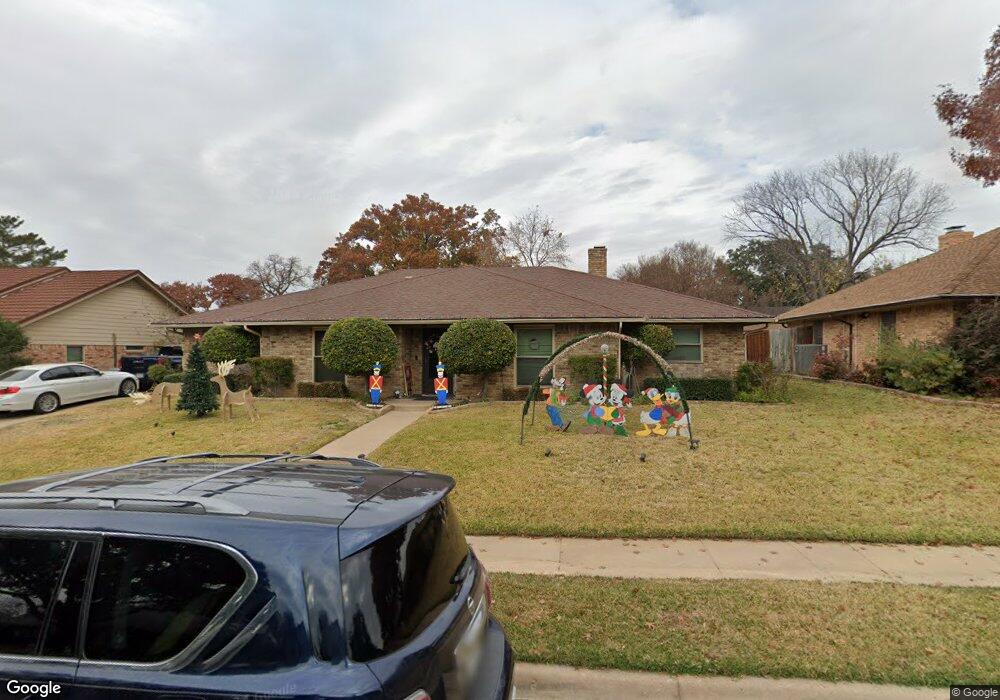
321 Warbler Dr Bedford, TX 76021
Estimated Value: $461,000 - $476,000
4
Beds
3
Baths
2,323
Sq Ft
$201/Sq Ft
Est. Value
About This Home
This home is located at 321 Warbler Dr, Bedford, TX 76021 and is currently estimated at $467,200, approximately $201 per square foot. 321 Warbler Dr is a home located in Tarrant County with nearby schools including Bedford Heights Elementary School, Bedford Junior High School, and L.D. Bell High School.
Ownership History
Date
Name
Owned For
Owner Type
Purchase Details
Closed on
Dec 23, 1998
Sold by
Wilhoit Jonathan and Bell Charlotte Lynne
Bought by
Woodward Paul W and Woodward Dalia S
Current Estimated Value
Home Financials for this Owner
Home Financials are based on the most recent Mortgage that was taken out on this home.
Original Mortgage
$110,000
Outstanding Balance
$24,900
Interest Rate
6.74%
Estimated Equity
$442,300
Purchase Details
Closed on
Sep 28, 1993
Sold by
Frith Jimmy L and Frith Mary A
Bought by
Wilhoit Jonathan and Beil Charlotte Lynne
Home Financials for this Owner
Home Financials are based on the most recent Mortgage that was taken out on this home.
Original Mortgage
$120,953
Interest Rate
6.93%
Create a Home Valuation Report for This Property
The Home Valuation Report is an in-depth analysis detailing your home's value as well as a comparison with similar homes in the area
Home Values in the Area
Average Home Value in this Area
Purchase History
| Date | Buyer | Sale Price | Title Company |
|---|---|---|---|
| Woodward Paul W | -- | Lone Star Title | |
| Wilhoit Jonathan | -- | Safeco Land Title Co |
Source: Public Records
Mortgage History
| Date | Status | Borrower | Loan Amount |
|---|---|---|---|
| Open | Woodward Paul W | $110,000 | |
| Previous Owner | Wilhoit Jonathan | $120,953 |
Source: Public Records
Tax History Compared to Growth
Tax History
| Year | Tax Paid | Tax Assessment Tax Assessment Total Assessment is a certain percentage of the fair market value that is determined by local assessors to be the total taxable value of land and additions on the property. | Land | Improvement |
|---|---|---|---|---|
| 2025 | $2,390 | $432,702 | $100,000 | $332,702 |
| 2024 | $2,390 | $432,702 | $100,000 | $332,702 |
| 2023 | $7,151 | $425,133 | $75,000 | $350,133 |
| 2022 | $7,403 | $338,948 | $75,000 | $263,948 |
| 2021 | $7,805 | $331,345 | $75,000 | $256,345 |
| 2020 | $7,275 | $314,874 | $75,000 | $239,874 |
| 2019 | $6,758 | $304,358 | $75,000 | $229,358 |
| 2018 | $4,005 | $252,890 | $75,000 | $177,890 |
| 2017 | $5,562 | $263,350 | $45,000 | $218,350 |
| 2016 | $5,056 | $253,503 | $45,000 | $208,503 |
| 2015 | $4,496 | $190,000 | $26,000 | $164,000 |
| 2014 | $4,496 | $190,000 | $26,000 | $164,000 |
Source: Public Records
Map
Nearby Homes
- 305 Warbler Dr
- 405 Woodbriar Ct
- 320 Blue Quail Ct
- 3605 Spring Valley Dr
- 3213 Spring Valley Dr
- 628 Huntwich Dr
- 3713 Brentwood Ct
- 3119 Spring Grove Dr
- 3609 Wayne Ct
- 909 Brestol Ct W
- 913 Kensington Ct
- 3624 Wayne Ct
- 432 Sunnybrook Ct
- 404 Heather Ln
- 2620 Brookridge Dr
- 801 Shady Creek Ln
- 2212 Mountainview Dr
- 2244 Hurstview Dr
- 922 Shady Creek Ln
- 2732 Woodbridge Dr
- 317 Warbler Dr
- 325 Warbler Dr
- 309 Quail Crest Dr
- 311 Quail Crest Dr
- 307 Quail Crest Dr
- 313 Warbler Dr
- 324 Warbler Dr
- 333 Warbler Dr
- 320 Warbler Dr
- 332 Warbler Dr
- 313 Quail Crest Dr
- 305 Quail Crest Dr
- 316 Warbler Dr
- 309 Warbler Dr
- 304 Quail Crest Dr
- 325 Eagle Dr
- 303 Quail Crest Dr
- 312 Warbler Dr
- 333 Eagle Dr
- 401 Warbler Dr