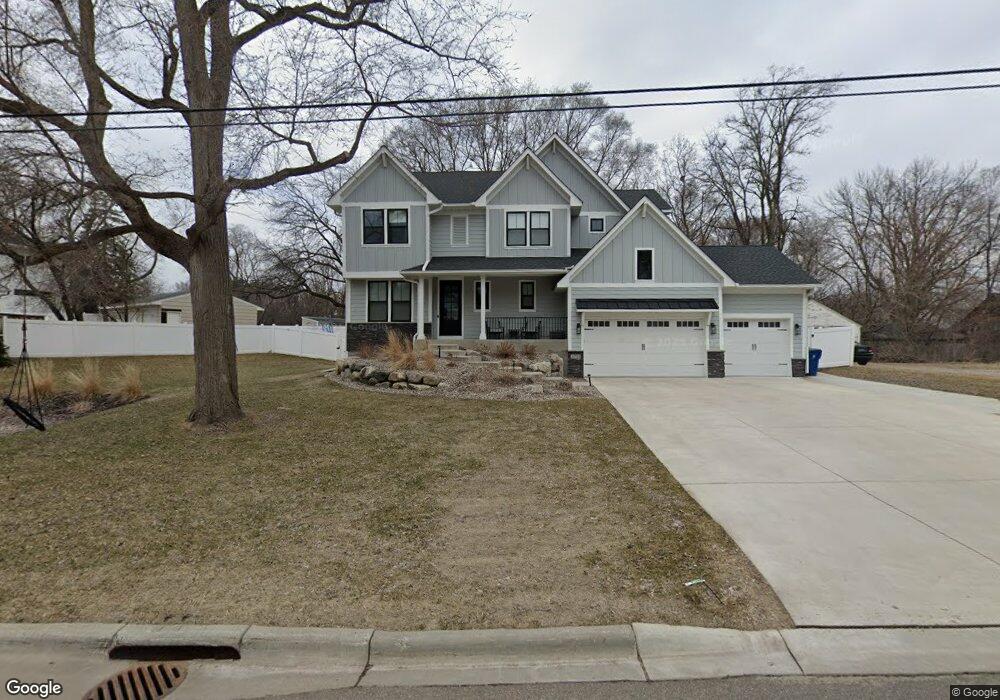
3210 Lake Shore Blvd Wayzata, MN 55391
Estimated Value: $1,141,146 - $1,897,000
5
Beds
5
Baths
3,884
Sq Ft
$369/Sq Ft
Est. Value
About This Home
This home is located at 3210 Lake Shore Blvd, Wayzata, MN 55391 and is currently estimated at $1,432,037, approximately $368 per square foot. 3210 Lake Shore Blvd is a home located in Hennepin County with nearby schools including Groveland Elementary School, Minnetonka East Middle School, and Minnetonka Senior High School.
Ownership History
Date
Name
Owned For
Owner Type
Purchase Details
Closed on
Sep 14, 2020
Sold by
Shree Investments Llc
Bought by
Nelson Casey and Nelson Amy
Current Estimated Value
Home Financials for this Owner
Home Financials are based on the most recent Mortgage that was taken out on this home.
Original Mortgage
$510,400
Outstanding Balance
$452,946
Interest Rate
2.9%
Mortgage Type
New Conventional
Estimated Equity
$979,091
Purchase Details
Closed on
Jan 11, 2019
Sold by
Oberg Jack A
Bought by
Oberg Jack A and Oberg Jacqueline A
Purchase Details
Closed on
Oct 31, 2018
Sold by
Hunter Deborah
Bought by
Sherre Investments Llc
Home Financials for this Owner
Home Financials are based on the most recent Mortgage that was taken out on this home.
Original Mortgage
$598,000
Interest Rate
4.7%
Mortgage Type
Commercial
Purchase Details
Closed on
Nov 25, 2002
Sold by
Hendrickson Janet K
Bought by
Hunter Deborah
Purchase Details
Closed on
May 12, 2000
Sold by
Zweigle Molly
Bought by
Hendrickson Todd A and Hendrickson Janet K
Create a Home Valuation Report for This Property
The Home Valuation Report is an in-depth analysis detailing your home's value as well as a comparison with similar homes in the area
Home Values in the Area
Average Home Value in this Area
Purchase History
| Date | Buyer | Sale Price | Title Company |
|---|---|---|---|
| Nelson Casey | $980,000 | Midland Title | |
| Oberg Jack A | -- | None Listed On Document | |
| Sherre Investments Llc | $247,500 | Midland Title | |
| Hunter Deborah | $163,000 | -- | |
| Hendrickson Todd A | $132,000 | -- |
Source: Public Records
Mortgage History
| Date | Status | Borrower | Loan Amount |
|---|---|---|---|
| Open | Nelson Casey | $510,400 | |
| Previous Owner | Sherre Investments Llc | $598,000 |
Source: Public Records
Tax History Compared to Growth
Tax History
| Year | Tax Paid | Tax Assessment Tax Assessment Total Assessment is a certain percentage of the fair market value that is determined by local assessors to be the total taxable value of land and additions on the property. | Land | Improvement |
|---|---|---|---|---|
| 2024 | $15,385 | $1,062,300 | $289,300 | $773,000 |
| 2023 | $14,482 | $1,057,000 | $289,300 | $767,700 |
| 2022 | $13,705 | $1,011,200 | $289,300 | $721,900 |
| 2021 | $3,002 | $917,900 | $263,000 | $654,900 |
| 2020 | $3,331 | $231,700 | $184,000 | $47,700 |
| 2019 | $2,621 | $233,100 | $184,000 | $49,100 |
| 2018 | $3,495 | $197,200 | $184,000 | $13,200 |
| 2017 | $3,597 | $187,700 | $169,900 | $17,800 |
| 2016 | $2,164 | $165,100 | $155,000 | $10,100 |
| 2015 | $2,749 | $163,600 | $150,000 | $13,600 |
| 2014 | -- | $162,800 | $150,000 | $12,800 |
Source: Public Records
Map
Nearby Homes
- 16418 Minnetonka Blvd
- 16612 Minnetonka Blvd
- 3401 Meadow Ln
- 3061 Lake Shore Blvd
- 15700 La Bon Terrace
- 17209 Grays Bay Blvd
- 3337 Jidana Ln
- 3205 County Road 101
- 3115 County Road 101 S
- 3515 County Road 101
- 3100 County Road 101 S
- 15503 Robinwood Dr
- 16110 Crosby Cove Rd
- 3500 Leroy St
- 1651X Hidden Valley Rd
- 165xx Hidden Valley Rd
- 17820 Valley Cove Ct
- 17945 Breezy Point Rd
- 4532xx Fairview Ave
- 17870 Breezy Point Rd
- 3222 Lake Shore Blvd
- 3166 Lake Shore Blvd
- 3219 Lake Shore Blvd
- 3226 Lake Shore Blvd
- 3160 Lake Shore Blvd
- 3219 3219 Lake Shore-Boulevard-
- 3219 3219 Lake Shore Blvd
- 3186 Lake Shore Blvd
- 3207 Highland Ave
- 3227 Lake Shore Blvd
- 3165 Lake Shore Blvd
- 3165 3165 Lake Shore-Boulevard-
- 3165 3165 Lake Shore Blvd
- 3173 3173 Lake Shore Blvd
- 3173 Lake Shore Blvd
- 3177 Lake Shore Blvd
- 3169 Lake Shore Blvd
- 3161 Lake Shore Blvd
- 3XXX Fairlawn Dr
- 3181 Lake Shore Blvd