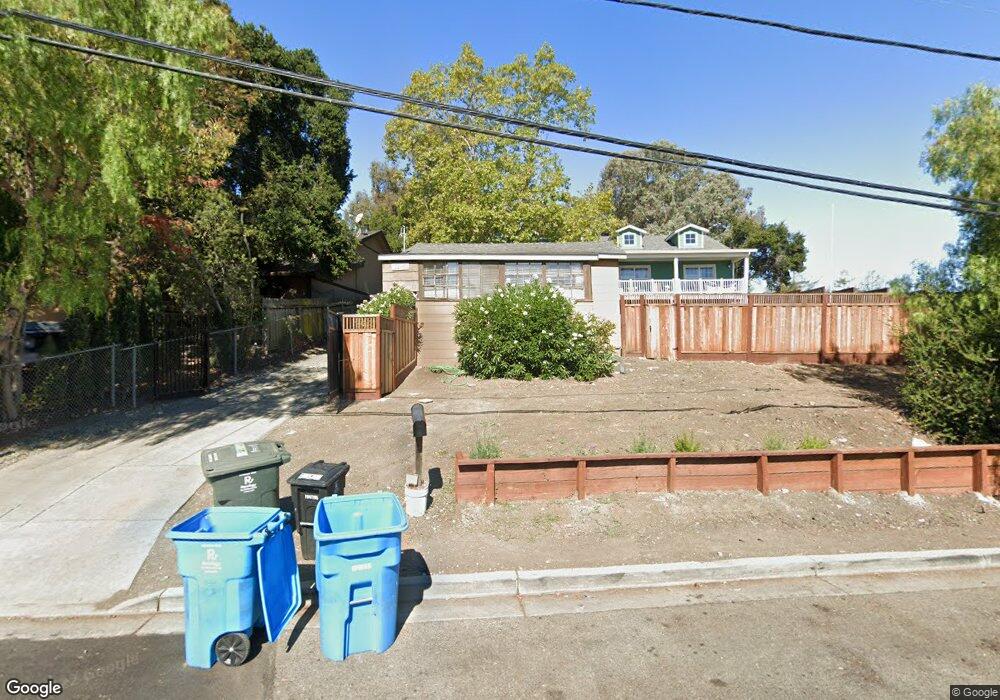
3210 Oak Knoll Dr Emerald Hills, CA 94062
Estimated Value: $2,393,000 - $2,931,000
2
Beds
6
Baths
2,179
Sq Ft
$1,235/Sq Ft
Est. Value
About This Home
This home is located at 3210 Oak Knoll Dr, Emerald Hills, CA 94062 and is currently estimated at $2,691,719, approximately $1,235 per square foot. 3210 Oak Knoll Dr is a home located in San Mateo County with nearby schools including Roy Cloud Elementary School, John F. Kennedy Middle School, and Woodside High School.
Ownership History
Date
Name
Owned For
Owner Type
Purchase Details
Closed on
Dec 17, 2018
Sold by
Murphy Jeri A and The John And Jeri Murphy Trust
Bought by
Murphy Jeri Anne and The John And Jeri Murphy Trust
Current Estimated Value
Home Financials for this Owner
Home Financials are based on the most recent Mortgage that was taken out on this home.
Original Mortgage
$1,000,000
Outstanding Balance
$882,780
Interest Rate
4.9%
Mortgage Type
New Conventional
Estimated Equity
$1,808,939
Purchase Details
Closed on
Jun 19, 2017
Sold by
Murphy Jeri
Bought by
Murphy Jeri A and John & Jeri Murphy Trust
Home Financials for this Owner
Home Financials are based on the most recent Mortgage that was taken out on this home.
Original Mortgage
$636,150
Interest Rate
4.05%
Mortgage Type
New Conventional
Purchase Details
Closed on
Mar 1, 2007
Sold by
Murphy John Patrick
Bought by
Murphy John P and Murphy Jeri A
Create a Home Valuation Report for This Property
The Home Valuation Report is an in-depth analysis detailing your home's value as well as a comparison with similar homes in the area
Home Values in the Area
Average Home Value in this Area
Purchase History
| Date | Buyer | Sale Price | Title Company |
|---|---|---|---|
| Murphy Jeri Anne | $10,000 | Old Republic Title Co | |
| Murphy Jeri A | -- | Fidelity National Title Co | |
| Murphy Jeri | -- | Fidelity National Title Co | |
| Murphy John P | -- | None Available |
Source: Public Records
Mortgage History
| Date | Status | Borrower | Loan Amount |
|---|---|---|---|
| Open | Murphy Jeri Anne | $1,000,000 | |
| Previous Owner | Murphy Jeri | $636,150 |
Source: Public Records
Tax History Compared to Growth
Tax History
| Year | Tax Paid | Tax Assessment Tax Assessment Total Assessment is a certain percentage of the fair market value that is determined by local assessors to be the total taxable value of land and additions on the property. | Land | Improvement |
|---|---|---|---|---|
| 2025 | $13,090 | $1,097,535 | $31,846 | $1,065,689 |
| 2023 | $13,090 | $1,054,919 | $30,610 | $1,024,309 |
| 2022 | $12,255 | $1,034,235 | $30,010 | $1,004,225 |
| 2021 | $10,029 | $917,957 | $29,422 | $888,535 |
| 2020 | $1,097 | $90,121 | $29,121 | $61,000 |
| 2019 | $916 | $72,263 | $28,550 | $43,713 |
| 2018 | $818 | $70,847 | $27,991 | $42,856 |
| 2017 | $809 | $69,459 | $27,443 | $42,016 |
| 2016 | $768 | $68,098 | $26,905 | $41,193 |
| 2015 | $741 | $67,076 | $26,501 | $40,575 |
| 2014 | $727 | $65,763 | $25,982 | $39,781 |
Source: Public Records
Map
Nearby Homes
- 00 Canyon Rd
- 505 Summit Dr
- 723 Canyon Rd
- 878 Hillcrest Dr
- 795 Canyon Rd
- 3554 Oak Knoll Dr
- 3451 Oak Knoll Dr
- 720 Vista Dr
- 3654 Altamont Way
- 2825 Hopkins Ave
- 268 Alameda de Las Pulgas
- 20 Don Ct
- 3647 Jefferson Ave
- 00 S Palomar Dr
- 717 Vernal Way
- 16 Niner Ct
- 0 S Palomar Dr
- 303 Lakeview Way
- 0 Sylvan Way Unit ML81963346
- 542 Topaz St
- 3214 Oak Knoll Dr
- 3218 Oak Knoll Dr
- 518 Hillside Rd
- 526 Hillside Rd
- 3215 Oak Knoll Dr
- 3201 Oak Knoll Dr Unit A
- 3201 Oak Knoll Dr
- 3215 Oak Knoll Dr Unit D
- 509 Hillside Rd
- 534 Hillside Rd
- 572 Canyon Rd
- 3221 Oak Knoll Dr
- 0 Canyon Rd
- 513 Hillside Rd
- 616 Canyon Rd
- 3226 Oak Knoll Dr
- 515 Hillside Rd
- 603 Canyon Rd
- 3180 Oak Knoll Dr
- 3227 Oak Knoll Dr