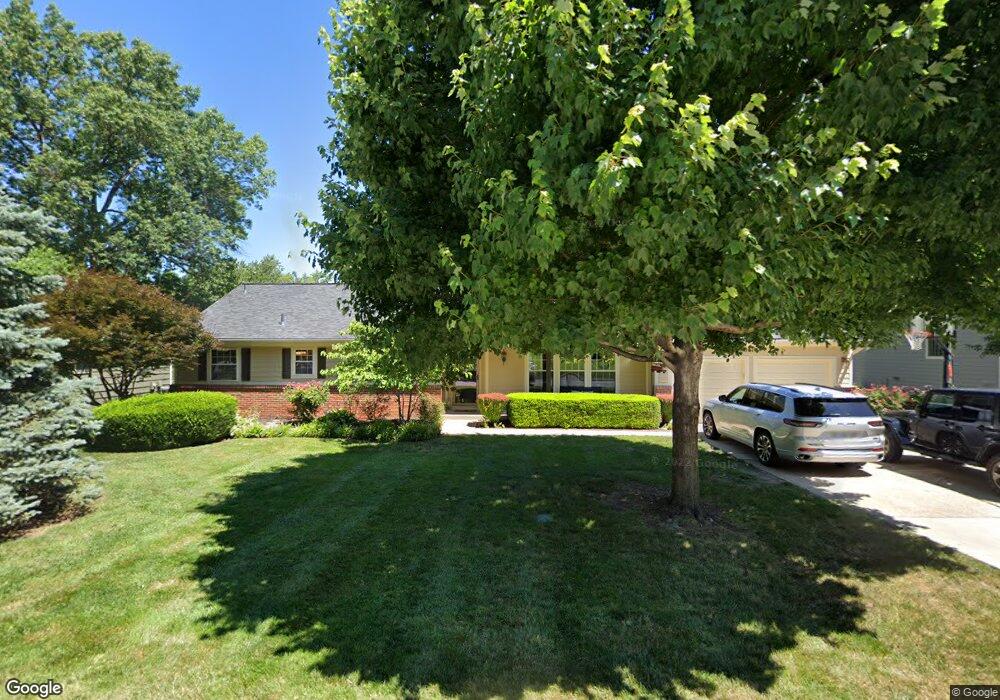
3210 W 82nd Terrace Leawood, KS 66206
Estimated Value: $650,000 - $976,000
4
Beds
3
Baths
2,424
Sq Ft
$331/Sq Ft
Est. Value
About This Home
This home is located at 3210 W 82nd Terrace, Leawood, KS 66206 and is currently estimated at $802,621, approximately $331 per square foot. 3210 W 82nd Terrace is a home located in Johnson County with nearby schools including Indian Hills Middle School, Shawnee Mission East High School, and Highlawn Montessori School.
Ownership History
Date
Name
Owned For
Owner Type
Purchase Details
Closed on
Mar 9, 2021
Sold by
Monroe Matthew T and Monroe Kelly M
Bought by
Monroe Matthew T and Monroe Kelly M
Current Estimated Value
Home Financials for this Owner
Home Financials are based on the most recent Mortgage that was taken out on this home.
Original Mortgage
$315,000
Outstanding Balance
$258,150
Interest Rate
2.7%
Mortgage Type
New Conventional
Estimated Equity
$544,471
Purchase Details
Closed on
Jan 23, 2013
Sold by
Monroe Ryan F
Bought by
Monrow Matthew T
Purchase Details
Closed on
Jul 6, 2005
Sold by
Immenschuh Mary Lou
Bought by
Monroe Matthew T and Monroe Ryan F
Home Financials for this Owner
Home Financials are based on the most recent Mortgage that was taken out on this home.
Original Mortgage
$295,000
Interest Rate
5.75%
Mortgage Type
Adjustable Rate Mortgage/ARM
Create a Home Valuation Report for This Property
The Home Valuation Report is an in-depth analysis detailing your home's value as well as a comparison with similar homes in the area
Home Values in the Area
Average Home Value in this Area
Purchase History
| Date | Buyer | Sale Price | Title Company |
|---|---|---|---|
| Monroe Matthew T | -- | Platinum Title Llc | |
| Monroe Matthew T | -- | Platinum Title | |
| Monrow Matthew T | -- | None Available | |
| Monroe Matthew T | -- | Kansas City Title |
Source: Public Records
Mortgage History
| Date | Status | Borrower | Loan Amount |
|---|---|---|---|
| Open | Monroe Matthew T | $315,000 | |
| Closed | Monroe Matthew T | $315,000 | |
| Previous Owner | Monroe Matthew T | $295,000 |
Source: Public Records
Tax History Compared to Growth
Tax History
| Year | Tax Paid | Tax Assessment Tax Assessment Total Assessment is a certain percentage of the fair market value that is determined by local assessors to be the total taxable value of land and additions on the property. | Land | Improvement |
|---|---|---|---|---|
| 2024 | $9,634 | $90,298 | $34,261 | $56,037 |
| 2023 | $9,349 | $87,204 | $31,150 | $56,054 |
| 2022 | $7,606 | $71,150 | $28,316 | $42,834 |
| 2021 | $7,606 | $64,871 | $28,316 | $36,555 |
| 2020 | $6,754 | $59,858 | $25,734 | $34,124 |
| 2019 | $6,165 | $54,809 | $21,446 | $33,363 |
| 2018 | $5,915 | $52,417 | $21,446 | $30,971 |
| 2017 | $5,436 | $47,449 | $16,490 | $30,959 |
| 2016 | $5,257 | $45,310 | $12,686 | $32,624 |
| 2015 | $5,189 | $45,080 | $12,686 | $32,394 |
| 2013 | -- | $43,263 | $10,564 | $32,699 |
Source: Public Records
Map
Nearby Homes
- 3004 W 83rd Terrace
- 2815 W 82nd St
- 3615 W 83rd Terrace
- 8228 Ensley Ln
- 8005 Ensley Ln
- 29 Compton Ct
- 8324 Meadow Ln
- 3906 W 84th Terrace
- 7819 Falmouth St
- 3907 W 84th Terrace
- 3903 W 84th Terrace
- 8605 Reinhardt Ln
- 7907 Bristol Ct
- 8020 Meadow Ln
- 3912 W 85th St
- 7 Le Mans Ct
- 7853 Howe Cir
- 8514 Belinder Rd
- 8361 Somerset Dr Unit 303
- 7740 Chadwick St
- 3206 W 82nd Terrace
- 3216 W 82nd Terrace
- 3211 W 82nd St
- 3207 W 82nd St
- 3220 W 82nd Terrace
- 3211 W 82nd Terrace
- 3213 W 82nd St
- 3207 W 82nd Terrace
- 3217 W 82nd Terrace
- 3201 W 82nd St
- 3201 W 82nd Terrace
- 3018 W 82nd Terrace
- 3225 W 82nd St
- 3023 W 82nd St
- 3224 W 82nd Terrace
- 3208 W 83rd St
- 3019 W 82nd Terrace
- 3204 W 83rd St
- 3219 W 82nd Terrace
- 3019 W 82nd St