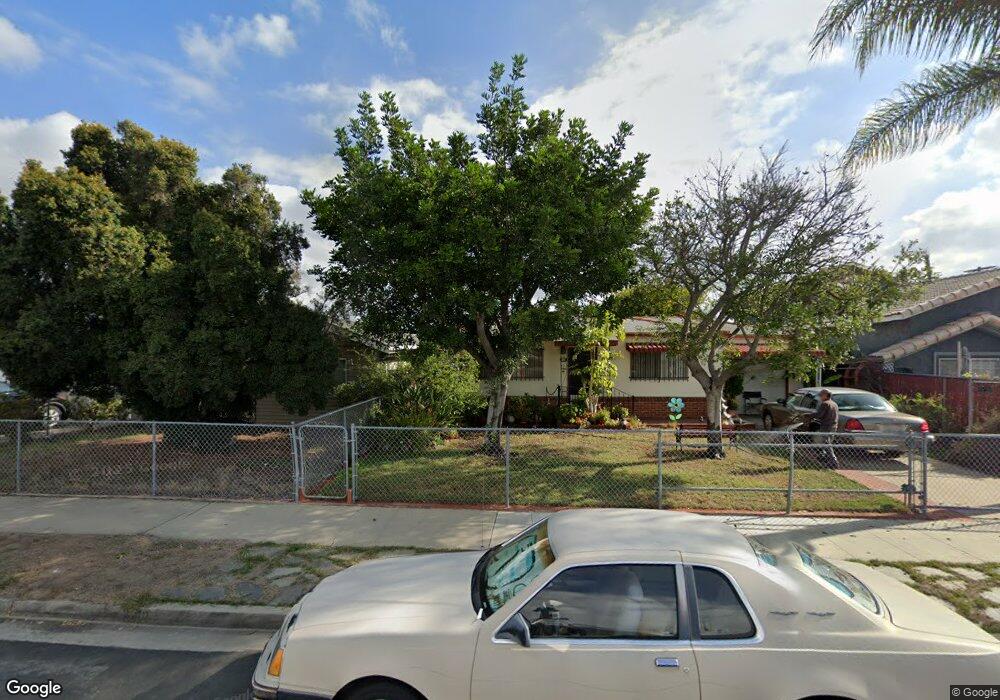
3211 39th St San Diego, CA 92105
Castle NeighborhoodEstimated Value: $637,876 - $690,000
2
Beds
1
Bath
814
Sq Ft
$828/Sq Ft
Est. Value
About This Home
This home is located at 3211 39th St, San Diego, CA 92105 and is currently estimated at $673,969, approximately $827 per square foot. 3211 39th St is a home located in San Diego County with nearby schools including Joyner Elementary School, Clark Middle School, and Herbert Hoover High School.
Ownership History
Date
Name
Owned For
Owner Type
Purchase Details
Closed on
Jun 21, 2005
Sold by
Bryson James K and Bryson Arnida A
Bought by
Sides Wilton J and Bryson Arnida A
Current Estimated Value
Home Financials for this Owner
Home Financials are based on the most recent Mortgage that was taken out on this home.
Original Mortgage
$200,000
Outstanding Balance
$103,200
Interest Rate
5.58%
Mortgage Type
Stand Alone Refi Refinance Of Original Loan
Estimated Equity
$570,769
Purchase Details
Closed on
Oct 12, 2004
Sold by
Smith Mary E
Bought by
Smith Mary E
Purchase Details
Closed on
Aug 28, 1996
Sold by
Home Svgs Of America Fsb
Bought by
Bryson James K and Bryson Arnida A
Home Financials for this Owner
Home Financials are based on the most recent Mortgage that was taken out on this home.
Original Mortgage
$57,000
Interest Rate
8.23%
Mortgage Type
Seller Take Back
Purchase Details
Closed on
Jul 9, 1996
Sold by
Betty Jadin
Bought by
Home Svgs Of America Fsb
Home Financials for this Owner
Home Financials are based on the most recent Mortgage that was taken out on this home.
Original Mortgage
$57,000
Interest Rate
8.23%
Mortgage Type
Seller Take Back
Purchase Details
Closed on
Dec 5, 1984
Purchase Details
Closed on
Jan 21, 1983
Create a Home Valuation Report for This Property
The Home Valuation Report is an in-depth analysis detailing your home's value as well as a comparison with similar homes in the area
Home Values in the Area
Average Home Value in this Area
Purchase History
| Date | Buyer | Sale Price | Title Company |
|---|---|---|---|
| Sides Wilton J | -- | Ticor Title Co Of California | |
| Smith Mary E | -- | -- | |
| Bryson James K | $60,000 | Stewart Title | |
| Home Svgs Of America Fsb | $61,088 | Stewart Title | |
| -- | $45,000 | -- | |
| -- | $43,000 | -- |
Source: Public Records
Mortgage History
| Date | Status | Borrower | Loan Amount |
|---|---|---|---|
| Open | Sides Wilton J | $200,000 | |
| Closed | Bryson James K | $57,000 |
Source: Public Records
Tax History Compared to Growth
Tax History
| Year | Tax Paid | Tax Assessment Tax Assessment Total Assessment is a certain percentage of the fair market value that is determined by local assessors to be the total taxable value of land and additions on the property. | Land | Improvement |
|---|---|---|---|---|
| 2025 | $1,125 | $97,687 | $63,429 | $34,258 |
| 2024 | $1,125 | $95,773 | $62,186 | $33,587 |
| 2023 | $1,098 | $93,896 | $60,967 | $32,929 |
| 2022 | $1,067 | $92,056 | $59,772 | $32,284 |
| 2021 | $1,059 | $90,251 | $58,600 | $31,651 |
| 2020 | $1,045 | $89,327 | $58,000 | $31,327 |
| 2019 | $1,026 | $87,576 | $56,863 | $30,713 |
| 2018 | $959 | $85,860 | $55,749 | $30,111 |
| 2017 | $82 | $84,177 | $54,656 | $29,521 |
| 2016 | $916 | $82,528 | $53,585 | $28,943 |
| 2015 | $902 | $81,290 | $52,781 | $28,509 |
| 2014 | $887 | $79,699 | $51,748 | $27,951 |
Source: Public Records
Map
Nearby Homes
- 3083 39th St
- 4128 Thorn St
- 3448-50 Cherokee Ave
- 0 42nd Unit PTP2505266
- 3450 42nd St
- 3005 Vancouver Ave
- 2931 Dahlia St Unit 12
- 3421 Vancouver Ave
- 4600 Myrtle Ave
- 2541 Haller St
- 3515 Vancouver Ave
- 3622 Landis St
- 2661 Montclair St
- 3728 Cherokee Ave
- 3322 Nile St
- 2537 Tuberose St
- 2609 Montclair St Unit 11
- 3606 Maple St Unit 12
- 3483 Olive St Unit 85
- 4183 Sycamore Dr