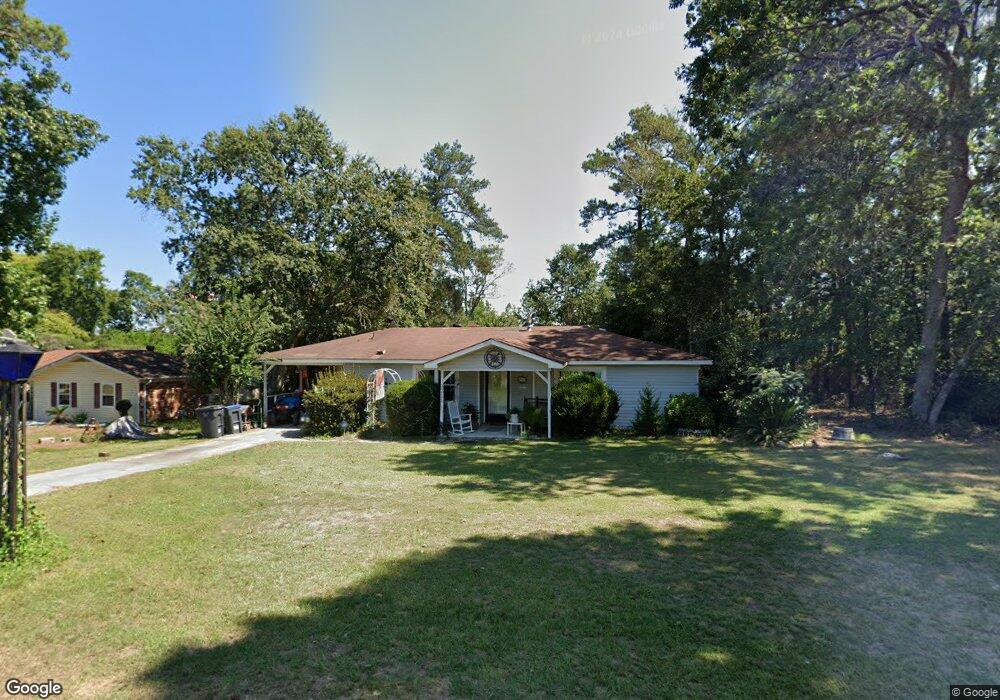
3211 Hillsview Dr Augusta, GA 30909
Belair NeighborhoodEstimated Value: $188,000 - $211,000
3
Beds
2
Baths
1,472
Sq Ft
$139/Sq Ft
Est. Value
About This Home
This home is located at 3211 Hillsview Dr, Augusta, GA 30909 and is currently estimated at $204,073, approximately $138 per square foot. 3211 Hillsview Dr is a home located in Richmond County with nearby schools including Belair K-8 School, Johnson Magnet, and Greater Augusta Christian Academy.
Ownership History
Date
Name
Owned For
Owner Type
Purchase Details
Closed on
Nov 12, 2007
Sold by
Woodhams Scott A
Bought by
Hunger Donald D
Current Estimated Value
Home Financials for this Owner
Home Financials are based on the most recent Mortgage that was taken out on this home.
Original Mortgage
$72,000
Outstanding Balance
$45,343
Interest Rate
6.29%
Mortgage Type
Purchase Money Mortgage
Estimated Equity
$158,730
Purchase Details
Closed on
Oct 27, 2005
Sold by
Stafford Donald L
Bought by
Woodhams Scott A
Home Financials for this Owner
Home Financials are based on the most recent Mortgage that was taken out on this home.
Original Mortgage
$70,000
Interest Rate
6.23%
Mortgage Type
Purchase Money Mortgage
Purchase Details
Closed on
May 23, 1997
Sold by
Johnson Kevin J Johnson Sheron D
Bought by
Stafford Donald L
Purchase Details
Closed on
Jun 1, 1990
Sold by
Harp James C
Bought by
Johnson Kevin J Johnson Sheron D
Create a Home Valuation Report for This Property
The Home Valuation Report is an in-depth analysis detailing your home's value as well as a comparison with similar homes in the area
Home Values in the Area
Average Home Value in this Area
Purchase History
| Date | Buyer | Sale Price | Title Company |
|---|---|---|---|
| Hunger Donald D | $90,000 | None Available | |
| Woodhams Scott A | $66,000 | None Available | |
| Stafford Donald L | $68,200 | -- | |
| Johnson Kevin J Johnson Sheron D | $58,600 | -- |
Source: Public Records
Mortgage History
| Date | Status | Borrower | Loan Amount |
|---|---|---|---|
| Open | Hunger Donald D | $72,000 | |
| Previous Owner | Woodhams Scott A | $70,000 |
Source: Public Records
Tax History Compared to Growth
Tax History
| Year | Tax Paid | Tax Assessment Tax Assessment Total Assessment is a certain percentage of the fair market value that is determined by local assessors to be the total taxable value of land and additions on the property. | Land | Improvement |
|---|---|---|---|---|
| 2024 | -- | $66,092 | $10,600 | $55,492 |
| 2023 | $1,143 | $61,596 | $10,600 | $50,996 |
| 2022 | $1,471 | $43,410 | $10,600 | $32,810 |
| 2021 | $1,455 | $39,458 | $10,600 | $28,858 |
| 2020 | $1,435 | $39,458 | $10,600 | $28,858 |
| 2019 | $1,243 | $31,203 | $8,480 | $22,723 |
| 2018 | $1,250 | $31,203 | $8,480 | $22,723 |
| 2017 | $1,216 | $31,203 | $8,480 | $22,723 |
| 2016 | $1,216 | $31,203 | $8,480 | $22,723 |
| 2015 | $1,348 | $31,203 | $8,480 | $22,723 |
| 2014 | $1,210 | $26,948 | $8,480 | $18,468 |
Source: Public Records
Map
Nearby Homes
- 3946 Carolyn St
- 3908 Carolyn St
- 3920 Carolyn St
- 3985 Belair Rd
- 3233 Peninsula Dr
- 610 Porcelain Ct
- 4407 Silverton Rd
- 4301 Leadville Ct
- 3422 Covington Ct
- 3908 Padrick St
- 3830 Maddox Rd
- 2928 Aylesbury Dr
- 3416 Covington Ct
- 3312 Camak Dr
- 3314 Camak Dr
- 3892 Harper Franklin Ave
- 3009 Norwood Ct
- 4321 Regans Ln
- 4308 Regans Ln
- 2305 Belair Spring Rd
- 3209 Hillsview Dr
- 3207 Hillsview Dr
- 3214 Hillsview Dr
- 3212 Hillsview Dr
- 3216 Hillsview Dr
- 3205 Hillsview Ct
- 3205 Hillsview Dr
- 3210 Hillsview Dr
- 3213 Hillsview Dr
- 3218 Hillsview Dr
- 3038 Mabus Dr
- 3208 Hillsview Dr
- 3203 Hillsview Ct
- 3203 Hillsview Dr
- 3213 Hillsview Dr
- 2203 Hillsview Ct
- 3211 Kings View Ct
- 2205 Hillsview Ct
- 2205 Hillsview Ct
- 3209 Kings View Ct