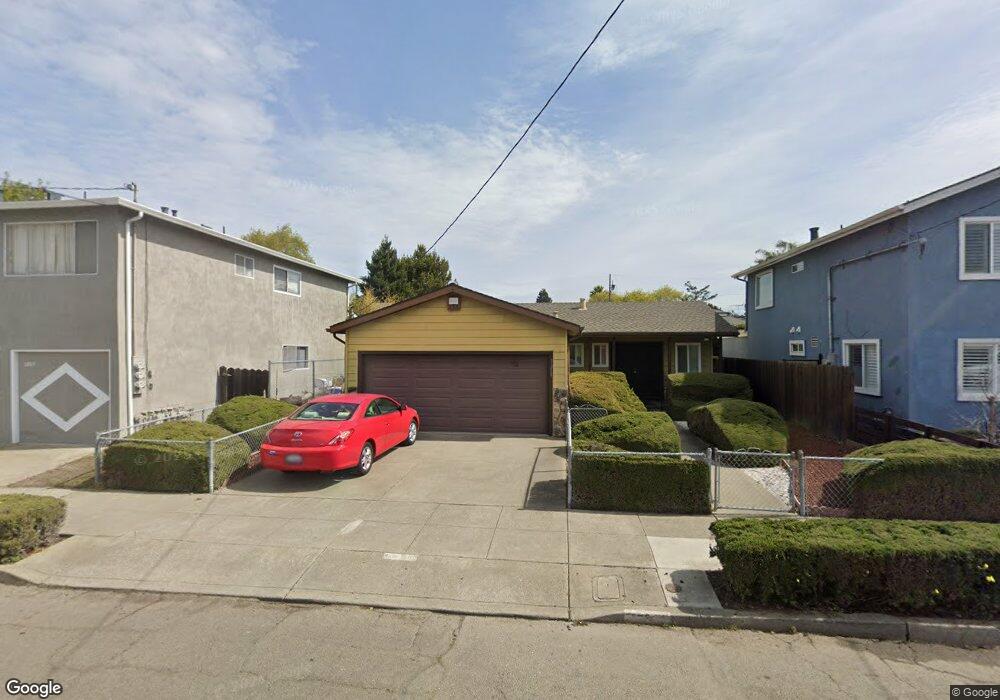
3211 Idaho St Berkeley, CA 94702
West Berkeley NeighborhoodEstimated Value: $1,103,600 - $1,392,000
2
Beds
2
Baths
1,544
Sq Ft
$774/Sq Ft
Est. Value
About This Home
This home is located at 3211 Idaho St, Berkeley, CA 94702 and is currently estimated at $1,195,150, approximately $774 per square foot. 3211 Idaho St is a home located in Alameda County with nearby schools including Malcolm X Elementary School, Washington Elementary School, and Oxford Elementary School.
Ownership History
Date
Name
Owned For
Owner Type
Purchase Details
Closed on
Apr 24, 2015
Sold by
Graves Robert E
Bought by
Livi Graves Robert E and Livi Robert E Graves Revocable
Current Estimated Value
Purchase Details
Closed on
Nov 23, 1998
Sold by
Moody Nettie Ruth
Bought by
Graves Robert E
Home Financials for this Owner
Home Financials are based on the most recent Mortgage that was taken out on this home.
Original Mortgage
$158,100
Outstanding Balance
$35,087
Interest Rate
6.78%
Mortgage Type
VA
Estimated Equity
$1,160,064
Create a Home Valuation Report for This Property
The Home Valuation Report is an in-depth analysis detailing your home's value as well as a comparison with similar homes in the area
Home Values in the Area
Average Home Value in this Area
Purchase History
| Date | Buyer | Sale Price | Title Company |
|---|---|---|---|
| Livi Graves Robert E | -- | None Available | |
| Graves Robert E | $158,500 | Old Republic Title Company |
Source: Public Records
Mortgage History
| Date | Status | Borrower | Loan Amount |
|---|---|---|---|
| Open | Graves Robert E | $158,100 |
Source: Public Records
Tax History
| Year | Tax Paid | Tax Assessment Tax Assessment Total Assessment is a certain percentage of the fair market value that is determined by local assessors to be the total taxable value of land and additions on the property. | Land | Improvement |
|---|---|---|---|---|
| 2025 | $3,515 | $67,682 | $72,894 | $170,086 |
| 2024 | $3,515 | $68,448 | $71,465 | $166,752 |
| 2023 | $3,480 | $233,547 | $70,064 | $163,483 |
| 2022 | $2,132 | $78,975 | $68,690 | $160,278 |
| 2021 | $2,113 | $76,945 | $67,344 | $157,136 |
| 2020 | $2,046 | $222,177 | $66,653 | $155,524 |
| 2019 | $4,585 | $217,822 | $65,346 | $152,476 |
| 2018 | $4,483 | $213,551 | $64,065 | $149,486 |
| 2017 | $4,298 | $209,365 | $62,809 | $146,556 |
| 2016 | $4,084 | $205,261 | $61,578 | $143,683 |
| 2015 | $4,018 | $202,178 | $60,653 | $141,525 |
| 2014 | $3,963 | $198,218 | $59,465 | $138,753 |
Source: Public Records
Map
Nearby Homes
- 1080 67th St
- 3224 Sacramento St
- 3032 Mabel St
- 6500 San Pablo Ave
- 3101 Sacramento St
- 6501 San Pablo Ave Unit 410
- 1314 Ashby Ave
- 6465 San Pablo Ave Unit 306
- 1507 Prince St
- 968 62nd St
- 3138 California St
- 3214 California St
- 3114 California St
- 1237 Ashby Ave
- 1124 63rd St
- 1164 Ocean Ave
- 1156 64th St
- 2922 Stanton St
- 1161 64th St
- 1200 65th St Unit 224
Your Personal Tour Guide
Ask me questions while you tour the home.