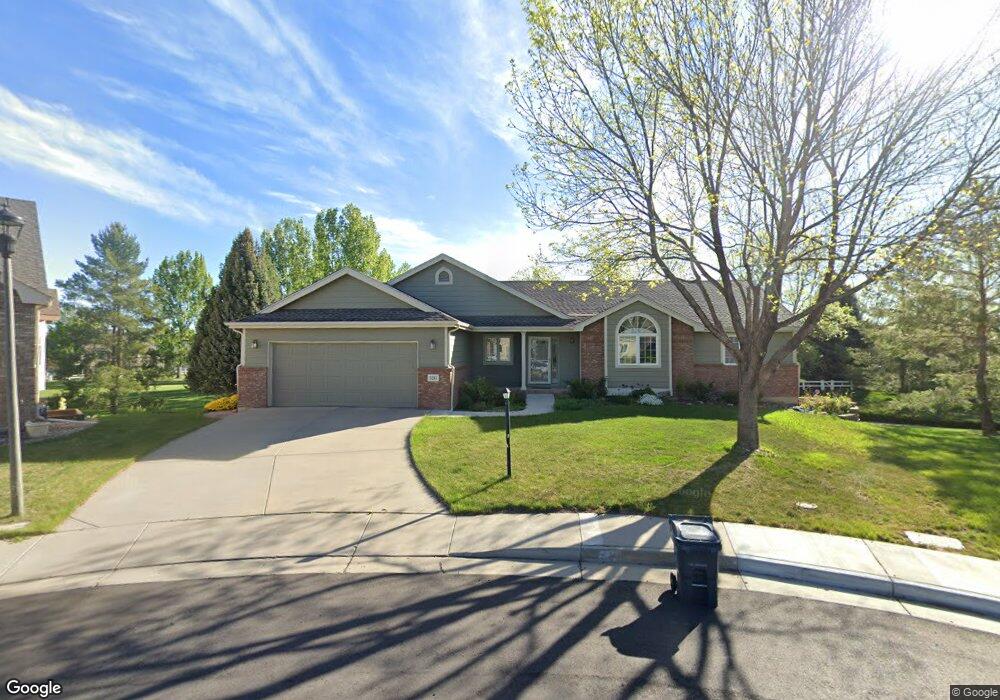
3211 Marcellina Place Loveland, CO 80537
Estimated Value: $629,431 - $740,000
4
Beds
3
Baths
3,499
Sq Ft
$193/Sq Ft
Est. Value
About This Home
This home is located at 3211 Marcellina Place, Loveland, CO 80537 and is currently estimated at $675,108, approximately $192 per square foot. 3211 Marcellina Place is a home located in Larimer County with nearby schools including Namaqua Elementary School, Walt Clark Middle School, and Thompson Valley High School.
Ownership History
Date
Name
Owned For
Owner Type
Purchase Details
Closed on
Aug 17, 2012
Sold by
Garrett Carolynn
Bought by
Schafer James M and Schafer Jennifer A
Current Estimated Value
Home Financials for this Owner
Home Financials are based on the most recent Mortgage that was taken out on this home.
Original Mortgage
$261,200
Outstanding Balance
$180,606
Interest Rate
3.63%
Mortgage Type
New Conventional
Estimated Equity
$494,502
Purchase Details
Closed on
Jan 23, 2002
Sold by
Garrett Carolynn G
Bought by
Garrett Carolynn
Home Financials for this Owner
Home Financials are based on the most recent Mortgage that was taken out on this home.
Original Mortgage
$80,000
Interest Rate
5.41%
Purchase Details
Closed on
Dec 15, 1998
Sold by
Rust Construction Inc
Bought by
Garrett Carolynn G
Home Financials for this Owner
Home Financials are based on the most recent Mortgage that was taken out on this home.
Original Mortgage
$65,000
Interest Rate
6.92%
Create a Home Valuation Report for This Property
The Home Valuation Report is an in-depth analysis detailing your home's value as well as a comparison with similar homes in the area
Home Values in the Area
Average Home Value in this Area
Purchase History
| Date | Buyer | Sale Price | Title Company |
|---|---|---|---|
| Schafer James M | $326,500 | Heritage Title | |
| Garrett Carolynn | -- | Chicago Title Co | |
| Garrett Carolynn G | $223,185 | -- |
Source: Public Records
Mortgage History
| Date | Status | Borrower | Loan Amount |
|---|---|---|---|
| Open | Schafer James M | $261,200 | |
| Previous Owner | Garrett Carolynn | $80,000 | |
| Previous Owner | Garrett Carolynn G | $65,000 |
Source: Public Records
Tax History Compared to Growth
Tax History
| Year | Tax Paid | Tax Assessment Tax Assessment Total Assessment is a certain percentage of the fair market value that is determined by local assessors to be the total taxable value of land and additions on the property. | Land | Improvement |
|---|---|---|---|---|
| 2025 | $3,062 | $42,049 | $3,082 | $38,967 |
| 2024 | $2,953 | $42,049 | $3,082 | $38,967 |
| 2022 | $2,426 | $30,483 | $3,197 | $27,286 |
| 2021 | $2,492 | $31,360 | $3,289 | $28,071 |
| 2020 | $2,615 | $32,890 | $3,289 | $29,601 |
| 2019 | $2,571 | $32,890 | $3,289 | $29,601 |
| 2018 | $2,412 | $29,304 | $3,312 | $25,992 |
| 2017 | $2,077 | $29,304 | $3,312 | $25,992 |
| 2016 | $1,961 | $26,738 | $3,662 | $23,076 |
| 2015 | $1,945 | $26,740 | $3,660 | $23,080 |
| 2014 | $1,707 | $22,700 | $3,660 | $19,040 |
Source: Public Records
Map
Nearby Homes
- 428 Candelaria Dr
- 450 Wapola Ave
- 543 Dana Ct
- 2821 5th St SW
- 1014 Prism Cactus Cir
- 115 Anders Ct
- 3700 W 1st St
- 3560 Peruvian Torch Dr
- 138 Pamela Dr
- 1158 Blue Agave Ct
- 1168 Blue Agave Ct
- 219 Medina Ct
- 1028 Cynthia Ct
- 2583 Begonia Ct
- 204 Shupe Cir
- 827 S Buckeye Dr
- 2828 Mango Place
- 706 S Gilpin Ave
- 1167 Cynthia Ct
- 264 Shupe Cir
- 3227 Marcellina Place
- 3218 Marcellina Place
- 498 Marcellina Dr
- 3176 Candelaria Place
- 3234 Marcellina Place
- 486 Marcellina Dr
- 3250 Marcellina Place
- 3128 Candelaria Place
- 474 Marcellina Dr
- 3139 Candelaria Place
- 3193 5th Place SW
- 3137 5th Place SW
- 522 Marcellina Dr
- 462 Marcellina Dr
- 3104 Candelaria Place
- 503 Marcellina Dr
- 487 Candelaria Dr
- 495 Marcellina Dr
- 3178 5th Place SW
- 511 Marcellina Dr