3211 Sylvan Ct Augusta, GA 30909
North Leg NeighborhoodEstimated Value: $227,000 - $257,000
4
Beds
2
Baths
1,836
Sq Ft
$129/Sq Ft
Est. Value
About This Home
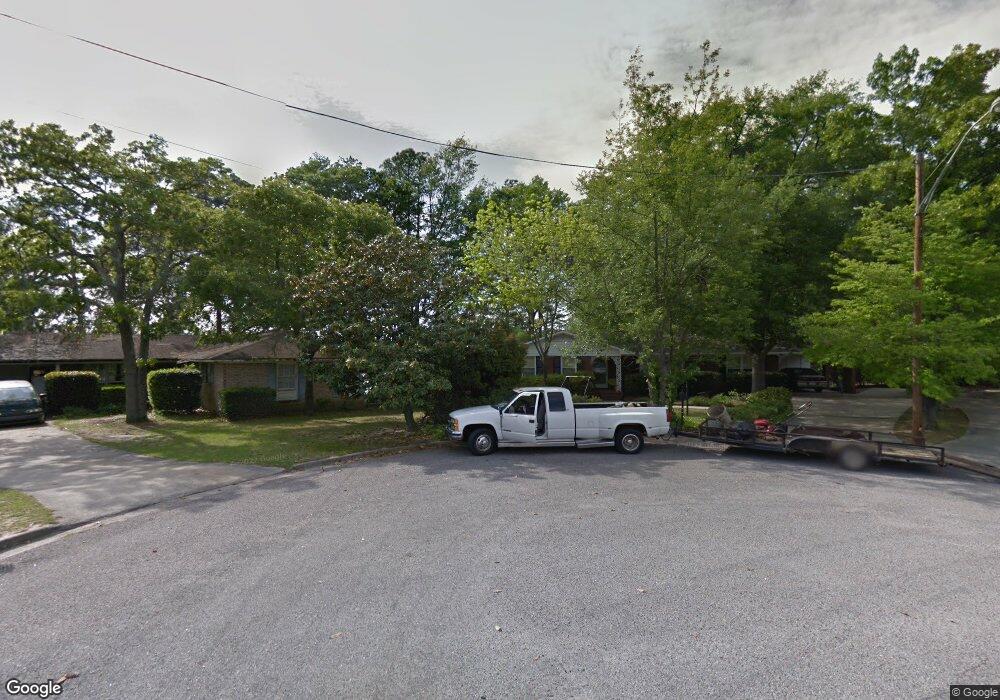
This home is located at 3211 Sylvan Ct, Augusta, GA 30909 and is currently estimated at $237,124, approximately $129 per square foot. 3211 Sylvan Ct is a home located in Richmond County with nearby schools including Copeland Elementary School, Johnson Magnet, and Academy of Richmond County High School.
Ownership History
Date
Name
Owned For
Owner Type
Purchase Details
Closed on
May 2, 2024
Sold by
Rofs Decker Alexa L
Bought by
Sile Shantel Djossi
Current Estimated Value
Home Financials for this Owner
Home Financials are based on the most recent Mortgage that was taken out on this home.
Original Mortgage
$240,000
Outstanding Balance
$236,373
Interest Rate
6.82%
Mortgage Type
New Conventional
Estimated Equity
$751
Purchase Details
Closed on
Oct 25, 2019
Sold by
Gsc Home Investments Llc
Bought by
Decker Alexa L and Cardona Vanessa K
Home Financials for this Owner
Home Financials are based on the most recent Mortgage that was taken out on this home.
Original Mortgage
$178,660
Interest Rate
3.6%
Purchase Details
Closed on
Jun 17, 2019
Sold by
Mclaughlin Luis Cicely
Bought by
Gsc Home Investments Llc
Purchase Details
Closed on
Sep 20, 2016
Sold by
Cicely W
Bought by
Luis Cicely Mclaughlin and Mclaughlin Cicely Woodrow Irre
Create a Home Valuation Report for This Property
The Home Valuation Report is an in-depth analysis detailing your home's value as well as a comparison with similar homes in the area
Home Values in the Area
Average Home Value in this Area
Purchase History
| Date | Buyer | Sale Price | Title Company |
|---|---|---|---|
| Sile Shantel Djossi | $250,000 | -- | |
| Decker Alexa L | $174,900 | -- | |
| Gsc Home Investments Llc | $82,000 | -- | |
| Luis Cicely Mclaughlin | -- | -- |
Source: Public Records
Mortgage History
| Date | Status | Borrower | Loan Amount |
|---|---|---|---|
| Open | Sile Shantel Djossi | $240,000 | |
| Previous Owner | Decker Alexa L | $178,660 |
Source: Public Records
Tax History
| Year | Tax Paid | Tax Assessment Tax Assessment Total Assessment is a certain percentage of the fair market value that is determined by local assessors to be the total taxable value of land and additions on the property. | Land | Improvement |
|---|---|---|---|---|
| 2025 | $470 | $92,340 | $8,000 | $84,340 |
| 2024 | $470 | $88,504 | $8,000 | $80,504 |
| 2023 | $2,770 | $82,032 | $8,000 | $74,032 |
| 2022 | $2,427 | $72,550 | $8,000 | $64,550 |
| 2021 | $2,084 | $54,921 | $8,000 | $46,921 |
| 2020 | $2,052 | $54,921 | $8,000 | $46,921 |
| 2019 | $1,842 | $44,720 | $8,000 | $36,720 |
| 2018 | $835 | $44,720 | $8,000 | $36,720 |
| 2017 | $774 | $44,720 | $8,000 | $36,720 |
| 2016 | $774 | $44,720 | $8,000 | $36,720 |
| 2015 | $774 | $44,720 | $8,000 | $36,720 |
| 2014 | $737 | $41,811 | $8,000 | $33,811 |
Source: Public Records
Map
Nearby Homes
- 1904 Aspen Green Way
- 3254 Summerchase Cir
- 3242 Summerchase Cir
- 1602 Wildwood Dr
- 3009 Bramble Wood Trail
- 3004 Bramble Wood Trail
- 3314 Idlewild Dr
- 1426 Springview Dr
- 3314 Forest Estates Dr
- 1421 Springview Dr
- 3317 Forest Estates Dr
- 3221 Alpine Rd
- 3340 Bardot Dr
- 3427 Heather Dr
- 1439 Ridgewood Dr
- 2141 Veterans Dr
- 1408 Jackson Rd
- 2145 Veterans Dr
- 2149 NW Veterans Dr
- 3372 Beaver Dr
- 3211 Sylvan Ct
- 3209 Sylvan Ct
- 3210 Sylvan Ct
- 1809 Valley Park Ct
- 1807 Valley Park Ct
- 3208 Sylvan Ct
- 3207 Sylvan Ct
- 3206 Sylvan Ct
- 3212 Trailwood Ct
- 3205 Sylvan Ct
- 3204 Sylvan Ct
- 1805 Valley Park Ct
- 1813 Valley Park W
- 3209 Trailwood Ct
- 1811W Valley Park Ct
- 1805W Valley Park W
- 1803W Valley Park Ct
- 1803 Valley Park W
- 1803 Valley Park Ct
- 3210 Trailwood Ct
Your Personal Tour Guide
Ask me questions while you tour the home.