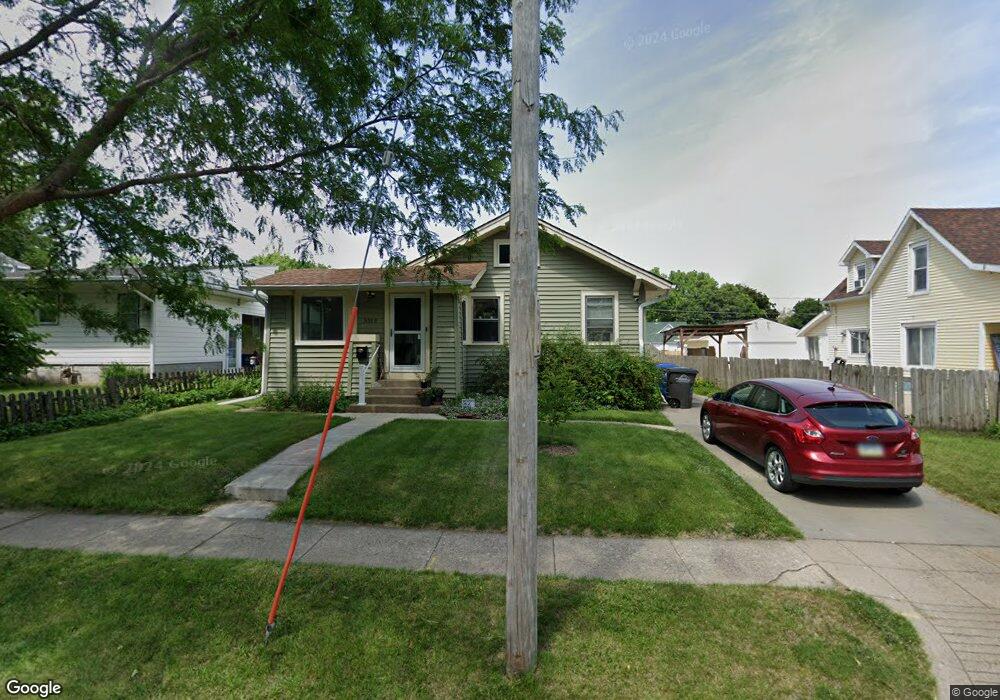
3212 E 8th St Des Moines, IA 50316
Highland Park NeighborhoodEstimated Value: $154,370 - $176,000
2
Beds
1
Bath
932
Sq Ft
$174/Sq Ft
Est. Value
About This Home
This home is located at 3212 E 8th St, Des Moines, IA 50316 and is currently estimated at $162,093, approximately $173 per square foot. 3212 E 8th St is a home located in Polk County with nearby schools including Cattell Elementary School, Harding Middle School, and North High School.
Ownership History
Date
Name
Owned For
Owner Type
Purchase Details
Closed on
Sep 29, 2023
Sold by
Bowler Naomi R
Bought by
Naomi R Bowler Revocable Trust and Bowler
Current Estimated Value
Purchase Details
Closed on
Feb 23, 2002
Sold by
Swensen Kevin D and Swensen Kathy S
Bought by
Bowler Naomi R
Home Financials for this Owner
Home Financials are based on the most recent Mortgage that was taken out on this home.
Original Mortgage
$66,575
Interest Rate
7.11%
Purchase Details
Closed on
Feb 21, 2002
Sold by
Bredesky Elaine and Bredesky Louis
Bought by
Swensen Kevin D
Home Financials for this Owner
Home Financials are based on the most recent Mortgage that was taken out on this home.
Original Mortgage
$66,575
Interest Rate
7.11%
Purchase Details
Closed on
Oct 23, 1998
Sold by
Bredesky Elaine
Bought by
Swenson Kevin D
Create a Home Valuation Report for This Property
The Home Valuation Report is an in-depth analysis detailing your home's value as well as a comparison with similar homes in the area
Home Values in the Area
Average Home Value in this Area
Purchase History
| Date | Buyer | Sale Price | Title Company |
|---|---|---|---|
| Naomi R Bowler Revocable Trust | -- | None Listed On Document | |
| Bowler Naomi R | $67,000 | -- | |
| Swensen Kevin D | -- | -- | |
| Swenson Kevin D | -- | -- |
Source: Public Records
Mortgage History
| Date | Status | Borrower | Loan Amount |
|---|---|---|---|
| Previous Owner | Bowler Naomi R | $66,575 | |
| Closed | Bowler Naomi R | $11,700 |
Source: Public Records
Tax History Compared to Growth
Tax History
| Year | Tax Paid | Tax Assessment Tax Assessment Total Assessment is a certain percentage of the fair market value that is determined by local assessors to be the total taxable value of land and additions on the property. | Land | Improvement |
|---|---|---|---|---|
| 2025 | $2,514 | $148,700 | $31,600 | $117,100 |
| 2024 | $2,514 | $127,800 | $27,100 | $100,700 |
| 2023 | $2,314 | $127,800 | $27,100 | $100,700 |
| 2022 | $2,296 | $98,200 | $21,800 | $76,400 |
| 2021 | $2,138 | $98,200 | $21,800 | $76,400 |
| 2020 | $2,222 | $85,700 | $19,200 | $66,500 |
| 2019 | $2,050 | $85,700 | $19,200 | $66,500 |
| 2018 | $2,030 | $76,300 | $17,000 | $59,300 |
| 2017 | $1,878 | $76,300 | $17,000 | $59,300 |
| 2016 | $1,828 | $69,400 | $15,300 | $54,100 |
| 2015 | $1,828 | $69,400 | $15,300 | $54,100 |
| 2014 | $1,644 | $61,900 | $13,600 | $48,300 |
Source: Public Records
Map
Nearby Homes
- 3215 E 8th St
- 3210 E 7th St
- 3007 E 8th St
- 3120 Amherst St
- 3421 Amherst St
- 3409 Bowdoin St
- 816 Boyd St
- 414 E Ovid Ave
- 3507 Bowdoin St
- 3301 Columbia St
- 3623 Wright St
- 3704 Wright St
- 3701 Amherst St
- 2818 Bowdoin St
- 3007 Cornell St
- 3723 Wright St
- 903 Morton Ave
- 3308 Cambridge St
- 3416 Cambridge St
- 508 E Sheridan Ave