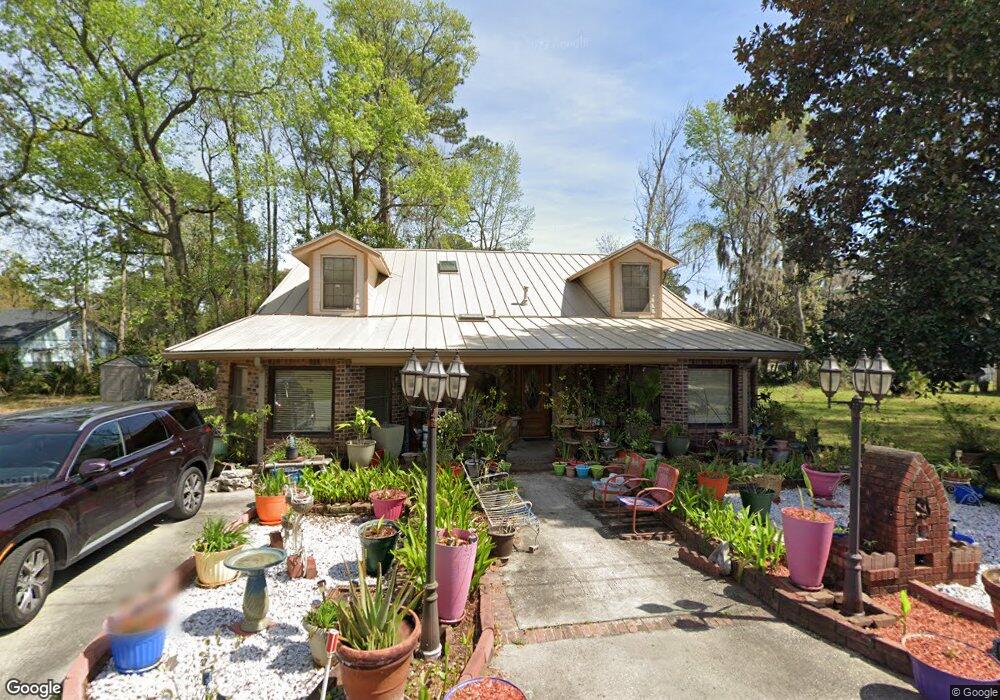
3212 Gragg St Savannah, GA 31404
Estimated Value: $473,000 - $556,000
4
Beds
3
Baths
3,397
Sq Ft
$149/Sq Ft
Est. Value
About This Home
This home is located at 3212 Gragg St, Savannah, GA 31404 and is currently estimated at $505,678, approximately $148 per square foot. 3212 Gragg St is a home located in Chatham County with nearby schools including Myers Middle School, Johnson High School, and Hancock Day School.
Ownership History
Date
Name
Owned For
Owner Type
Purchase Details
Closed on
Jul 22, 2013
Sold by
Johnson Darrell Glenn
Bought by
Johnson Thomas Campbell
Current Estimated Value
Create a Home Valuation Report for This Property
The Home Valuation Report is an in-depth analysis detailing your home's value as well as a comparison with similar homes in the area
Home Values in the Area
Average Home Value in this Area
Purchase History
| Date | Buyer | Sale Price | Title Company |
|---|---|---|---|
| Johnson Thomas Campbell | -- | -- | |
| Johnson Thomas Campbell | -- | -- |
Source: Public Records
Tax History Compared to Growth
Tax History
| Year | Tax Paid | Tax Assessment Tax Assessment Total Assessment is a certain percentage of the fair market value that is determined by local assessors to be the total taxable value of land and additions on the property. | Land | Improvement |
|---|---|---|---|---|
| 2025 | $3,015 | $185,880 | $22,400 | $163,480 |
| 2024 | $3,015 | $173,720 | $7,600 | $166,120 |
| 2023 | $2,370 | $166,720 | $7,600 | $159,120 |
| 2022 | $2,224 | $134,120 | $7,600 | $126,520 |
| 2021 | $2,201 | $117,080 | $7,600 | $109,480 |
| 2020 | $2,268 | $129,160 | $7,600 | $121,560 |
| 2019 | $2,229 | $129,160 | $7,600 | $121,560 |
| 2018 | $2,198 | $124,680 | $7,600 | $117,080 |
| 2017 | $1,972 | $110,480 | $7,600 | $102,880 |
| 2016 | $1,943 | $109,360 | $7,800 | $101,560 |
| 2015 | $1,938 | $110,080 | $7,800 | $102,280 |
| 2014 | $2,811 | $121,800 | $0 | $0 |
Source: Public Records
Map
Nearby Homes
- 3112 Falligant Ave
- 3107 Lincoln St
- 3105 Lincoln St
- 3010 Leonard St
- 3110 Wright Ave
- 3003 Leonard St
- 3322 Louis St
- 2902 River Dr Unit C101
- 3005 River Dr Unit 302
- 3005 River Dr Unit 511E
- 3005 River Dr Unit 108
- 3209 Woodlawn Dr
- 2812 River Dr Unit 106
- 3314 April St
- 2702 River Dr
- 5000 Taylor Rd
- 147 Bluffside Cir
- 2612 Whatley Ave Unit 13
- 3313 Martha St
- 46 S Parkwood Dr