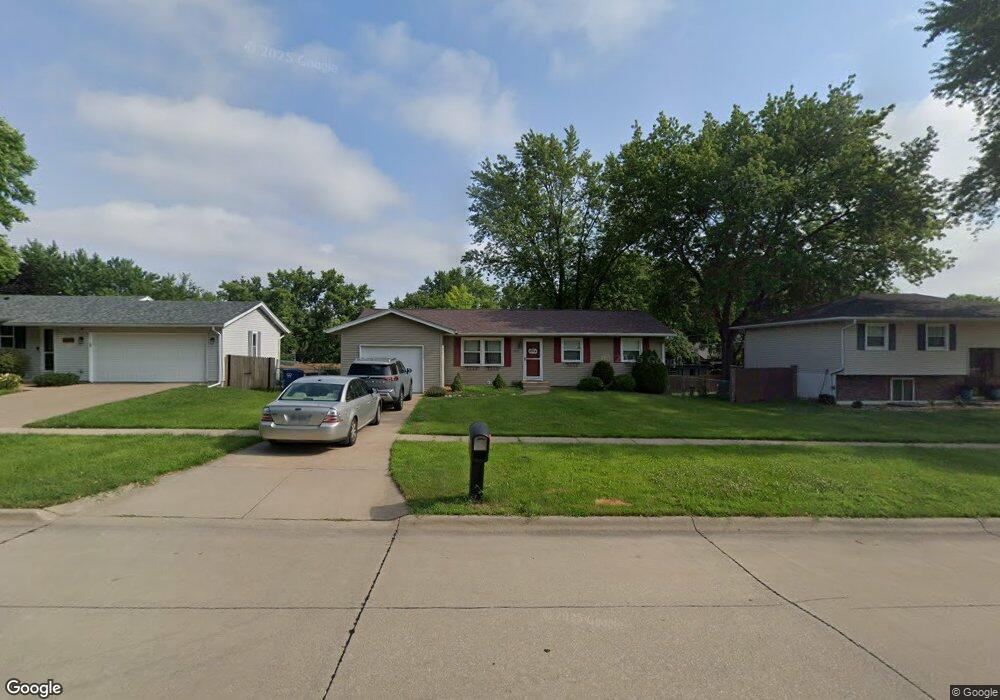
3212 Maplecrest Rd Bettendorf, IA 52722
Estimated Value: $219,000 - $248,000
4
Beds
2
Baths
1,314
Sq Ft
$183/Sq Ft
Est. Value
About This Home
This home is located at 3212 Maplecrest Rd, Bettendorf, IA 52722 and is currently estimated at $239,869, approximately $182 per square foot. 3212 Maplecrest Rd is a home located in Scott County with nearby schools including Riverdale Heights Elementary, Pleasant Valley Junior High School, and Pleasant Valley High School.
Ownership History
Date
Name
Owned For
Owner Type
Purchase Details
Closed on
Dec 28, 2023
Sold by
Zabel Ted and Zabel Diane
Bought by
Zabel Nathan
Current Estimated Value
Home Financials for this Owner
Home Financials are based on the most recent Mortgage that was taken out on this home.
Original Mortgage
$157,500
Outstanding Balance
$156,255
Interest Rate
7.44%
Mortgage Type
New Conventional
Estimated Equity
$83,614
Purchase Details
Closed on
Jun 6, 2023
Sold by
Saito Daniel R and Saito Janice N
Bought by
Zabel Ted and Zabel Diane
Home Financials for this Owner
Home Financials are based on the most recent Mortgage that was taken out on this home.
Original Mortgage
$157,500
Interest Rate
6.39%
Mortgage Type
New Conventional
Create a Home Valuation Report for This Property
The Home Valuation Report is an in-depth analysis detailing your home's value as well as a comparison with similar homes in the area
Home Values in the Area
Average Home Value in this Area
Purchase History
| Date | Buyer | Sale Price | Title Company |
|---|---|---|---|
| Zabel Nathan | $210,000 | None Listed On Document | |
| Zabel Ted | $210,000 | None Listed On Document |
Source: Public Records
Mortgage History
| Date | Status | Borrower | Loan Amount |
|---|---|---|---|
| Open | Zabel Nathan | $157,500 | |
| Previous Owner | Zabel Ted | $157,500 |
Source: Public Records
Tax History Compared to Growth
Tax History
| Year | Tax Paid | Tax Assessment Tax Assessment Total Assessment is a certain percentage of the fair market value that is determined by local assessors to be the total taxable value of land and additions on the property. | Land | Improvement |
|---|---|---|---|---|
| 2025 | $3,032 | $233,500 | $54,600 | $178,900 |
| 2024 | $3,078 | $196,900 | $30,300 | $166,600 |
| 2023 | $3,114 | $196,900 | $30,300 | $166,600 |
| 2022 | $3,084 | $171,200 | $30,300 | $140,900 |
| 2021 | $3,084 | $171,200 | $30,300 | $140,900 |
| 2020 | $2,972 | $159,390 | $30,300 | $129,090 |
| 2019 | $2,914 | $154,420 | $30,300 | $124,120 |
| 2018 | $2,858 | $154,420 | $30,300 | $124,120 |
| 2017 | $859 | $154,420 | $30,300 | $124,120 |
| 2016 | $2,582 | $137,230 | $0 | $0 |
| 2015 | $2,582 | $131,550 | $0 | $0 |
| 2014 | $2,508 | $131,550 | $0 | $0 |
| 2013 | $2,464 | $0 | $0 | $0 |
| 2012 | -- | $132,800 | $23,570 | $109,230 |
Source: Public Records
Map
Nearby Homes
- 3542 Cedarview Ct
- 3161 Willowwood Dr
- 3075 Willowwood Dr
- 3461 Cedarview Ct
- 3550 Devils Glen Rd
- 3374 N Willow Ct
- 3752 Cedarwood Ct
- 3750 Eastwood Ct
- 3766 Eastwood Ct
- 3121 Middle Haven Rd
- 4383 53rd Ave
- 4383 53rd Ave Unit 3
- 2956 Holiday Ct Unit Bldg. 4, Unit 7
- 4000 Prairie Ln
- 3885 Middle Rd
- 3988 Partridge Cir
- 3260 Parkwild Dr Unit 3D
- 2592 Middle Rd Unit 218
- 2592 Middle Rd Unit 202
- 2592 Middle Rd Unit 120
- 3208 Maplecrest Rd
- 3216 Maplecrest Rd
- 3187 Sunburst Dr
- 3167 Sunburst Dr
- 3207 Sunburst Dr
- 3204 Maplecrest Rd
- 3304 Maplecrest Rd
- 3147 Sunburst Dr
- 3227 Sunburst Dr
- 3211 Maplecrest Rd
- 3215 Maplecrest Rd
- 3207 Maplecrest Rd
- 3308 Maplecrest Rd
- 3303 Maplecrest Rd
- 3308 Maplecrest None
- 3203 Maplecrest Rd
- 3127 Sunburst Dr
- 3247 Sunburst Dr
- 3196 Sunburst Dr
- 3307 Maplecrest Rd