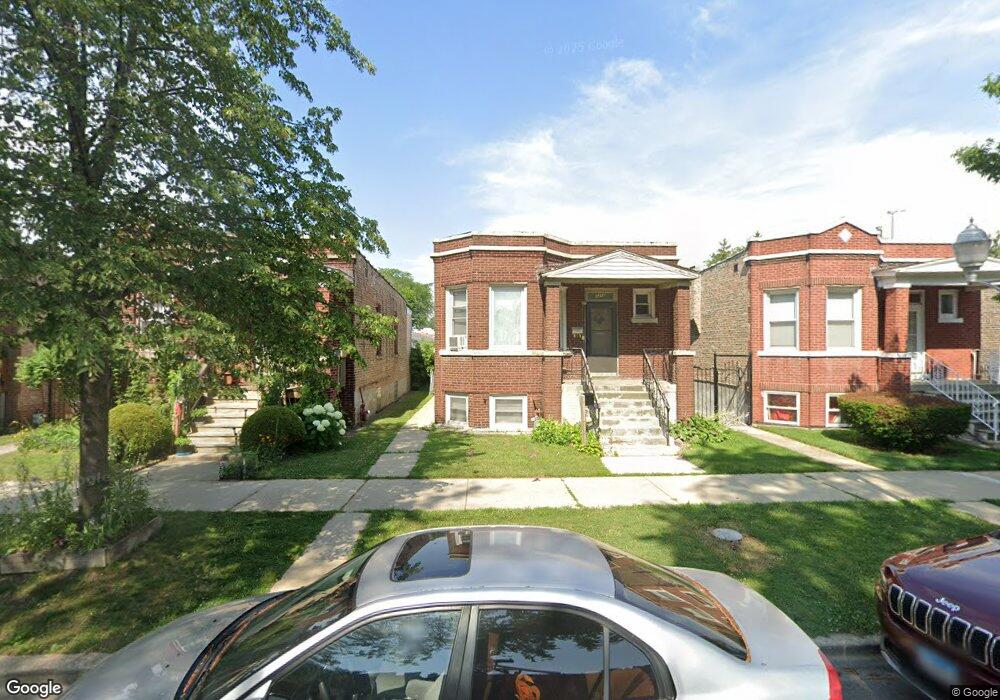
3212 S Hamlin Ave Chicago, IL 60623
Little Village NeighborhoodEstimated Value: $218,000 - $291,000
2
Beds
1
Bath
832
Sq Ft
$307/Sq Ft
Est. Value
About This Home
This home is located at 3212 S Hamlin Ave, Chicago, IL 60623 and is currently estimated at $255,403, approximately $306 per square foot. 3212 S Hamlin Ave is a home located in Cook County with nearby schools including Ortiz De Dominguez Elementary School, Gary Elementary School, and Grace Lutheran Academy.
Ownership History
Date
Name
Owned For
Owner Type
Purchase Details
Closed on
Mar 21, 2017
Sold by
Secretary Of Hud
Bought by
Gutierrez America Sandoval and Sandoval Rosa M
Current Estimated Value
Purchase Details
Closed on
May 2, 2016
Sold by
Wells Fargo Bank Na
Bought by
Secretary Of Hud
Purchase Details
Closed on
Jan 4, 2016
Sold by
Ramirez Luis and Ramirez Luis E
Bought by
Wells Fargo Bank Na
Purchase Details
Closed on
Aug 29, 2003
Sold by
Perez Jesus and Perez Maria
Bought by
Ramirez Luis E
Home Financials for this Owner
Home Financials are based on the most recent Mortgage that was taken out on this home.
Original Mortgage
$152,605
Interest Rate
5.97%
Mortgage Type
FHA
Purchase Details
Closed on
Nov 5, 1993
Sold by
Gonzalez Miguel and Gonzalez Maritza
Bought by
Perez Jesus and Perez Maria
Home Financials for this Owner
Home Financials are based on the most recent Mortgage that was taken out on this home.
Original Mortgage
$84,202
Interest Rate
6.96%
Mortgage Type
FHA
Create a Home Valuation Report for This Property
The Home Valuation Report is an in-depth analysis detailing your home's value as well as a comparison with similar homes in the area
Home Values in the Area
Average Home Value in this Area
Purchase History
| Date | Buyer | Sale Price | Title Company |
|---|---|---|---|
| Gutierrez America Sandoval | -- | Chicago Title | |
| Secretary Of Hud | -- | Attorney | |
| Wells Fargo Bank Na | -- | Attorney | |
| Ramirez Luis E | $155,000 | Multiple | |
| Perez Jesus | $56,666 | -- |
Source: Public Records
Mortgage History
| Date | Status | Borrower | Loan Amount |
|---|---|---|---|
| Previous Owner | Ramirez Luis E | $152,605 | |
| Previous Owner | Perez Jesus | $84,202 |
Source: Public Records
Tax History
| Year | Tax Paid | Tax Assessment Tax Assessment Total Assessment is a certain percentage of the fair market value that is determined by local assessors to be the total taxable value of land and additions on the property. | Land | Improvement |
|---|---|---|---|---|
| 2025 | $3,089 | $21,001 | $5,438 | $15,563 |
| 2024 | $3,089 | $21,001 | $5,438 | $15,563 |
| 2023 | $2,990 | $17,958 | $4,406 | $13,552 |
| 2022 | $2,990 | $17,958 | $4,406 | $13,552 |
| 2021 | $2,941 | $17,957 | $4,406 | $13,551 |
| 2020 | $3,006 | $13,493 | $4,406 | $9,087 |
| 2019 | $3,081 | $15,334 | $4,406 | $10,928 |
| 2018 | $3,029 | $15,334 | $4,406 | $10,928 |
| 2017 | $2,965 | $13,775 | $3,937 | $9,838 |
| 2016 | $2,759 | $13,775 | $3,937 | $9,838 |
| 2015 | $2,524 | $13,775 | $3,937 | $9,838 |
| 2014 | $2,552 | $13,755 | $3,750 | $10,005 |
| 2013 | $2,502 | $13,755 | $3,750 | $10,005 |
Source: Public Records
Map
Nearby Homes
- 3156 S Millard Ave
- 2847 S Harding Ave
- 3031 S Central Park Ave
- 2854 S Central Park Ave
- 2741 S Avers Ave
- 3026 S Saint Louis Ave
- 2838 S Keeler Ave
- 3022 S Homan Ave
- 2728 S Karlov Ave
- 3041 S Kildare Ave
- 2724 S Karlov Ave
- 2812 S Trumbull Ave
- 2541 S Springfield Ave
- 2527 S Harding Ave
- 1808 S Hamlin Ave
- 3003 S Kenneth Ave
- 3451 W 38th St
- 2433 S Harding Ave
- 2436 S Pulaski Rd
- 2838 S Troy St
- 3210 S Hamlin Ave
- 3216 S Hamlin Ave
- 3206 S Hamlin Ave
- 3208 S Hamlin Ave
- 3218 S Hamlin Ave
- 3204 S Hamlin Ave
- 3222 S Hamlin Ave
- 3200 S Hamlin Ave
- 3224 S Hamlin Ave
- 3215 S Avers Ave
- 3211 S Avers Ave
- 3217 S Avers Ave
- 3228 S Hamlin Ave
- 3207 S Avers Ave
- 3219 S Avers Ave
- 3205 S Avers Ave
- 3223 S Avers Ave
- 3230 S Hamlin Ave
- 3201 S Avers Ave
- 3225 S Avers Ave
Your Personal Tour Guide
Ask me questions while you tour the home.