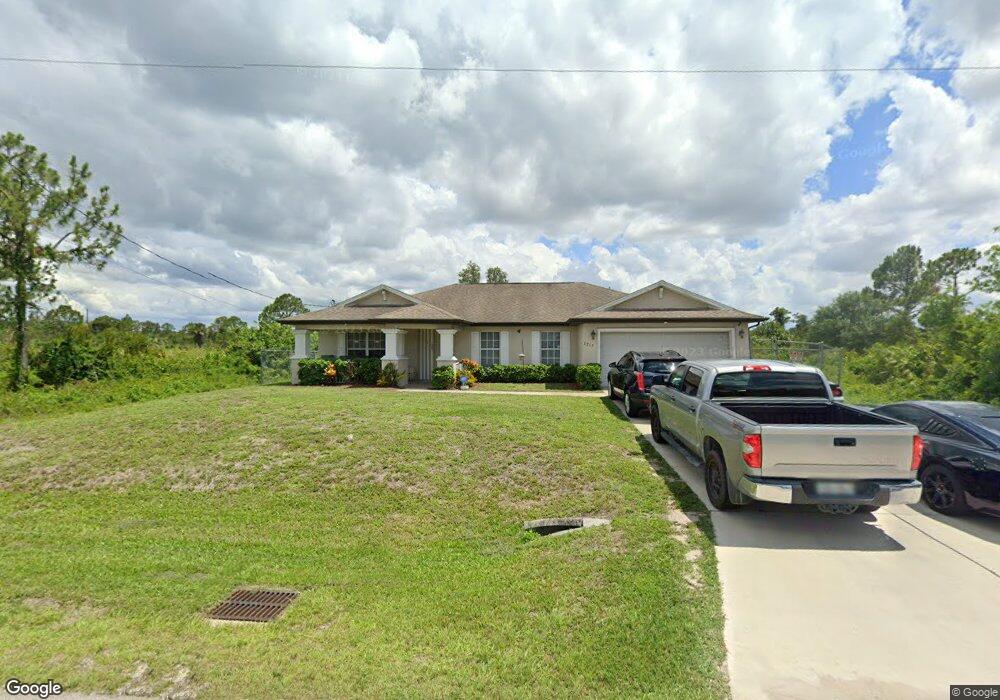
3213 53rd St W Unit 11 Lehigh Acres, FL 33971
Harris NeighborhoodEstimated Value: $309,000 - $403,000
3
Beds
2
Baths
1,790
Sq Ft
$188/Sq Ft
Est. Value
About This Home
This home is located at 3213 53rd St W Unit 11, Lehigh Acres, FL 33971 and is currently estimated at $336,147, approximately $187 per square foot. 3213 53rd St W Unit 11 is a home located in Lee County with nearby schools including Lehigh Elementary School, The Alva School, and Orange River Elementary School.
Ownership History
Date
Name
Owned For
Owner Type
Purchase Details
Closed on
Jul 17, 2008
Sold by
Hagar Christina
Bought by
Stubelt Angie M and Stubelt Jeremy
Current Estimated Value
Home Financials for this Owner
Home Financials are based on the most recent Mortgage that was taken out on this home.
Original Mortgage
$120,449
Outstanding Balance
$78,489
Interest Rate
6.27%
Mortgage Type
FHA
Estimated Equity
$257,658
Purchase Details
Closed on
Nov 23, 2005
Sold by
K Hovnanian First Homes Llc
Bought by
Hagar Christina
Home Financials for this Owner
Home Financials are based on the most recent Mortgage that was taken out on this home.
Original Mortgage
$218,277
Interest Rate
6.04%
Mortgage Type
Construction
Purchase Details
Closed on
Jul 19, 2004
Sold by
Quinn Thomas Leonard and Quinn Ernestine Ann
Bought by
First Home Builders Of Florida
Create a Home Valuation Report for This Property
The Home Valuation Report is an in-depth analysis detailing your home's value as well as a comparison with similar homes in the area
Home Values in the Area
Average Home Value in this Area
Purchase History
| Date | Buyer | Sale Price | Title Company |
|---|---|---|---|
| Stubelt Angie M | $122,400 | Omnione Title Services Llc | |
| Hagar Christina | $90,900 | First Home Title | |
| First Home Builders Of Florida | $8,500 | First Home Title Inc |
Source: Public Records
Mortgage History
| Date | Status | Borrower | Loan Amount |
|---|---|---|---|
| Open | Stubelt Angie M | $120,449 | |
| Previous Owner | Hagar Christina | $218,277 |
Source: Public Records
Tax History Compared to Growth
Tax History
| Year | Tax Paid | Tax Assessment Tax Assessment Total Assessment is a certain percentage of the fair market value that is determined by local assessors to be the total taxable value of land and additions on the property. | Land | Improvement |
|---|---|---|---|---|
| 2025 | $1,423 | $133,486 | -- | -- |
| 2024 | $1,331 | $81,278 | -- | -- |
| 2023 | $1,331 | $71,338 | $0 | $0 |
| 2022 | $1,069 | $65,125 | $0 | $0 |
| 2021 | $996 | $160,798 | $6,511 | $154,287 |
| 2020 | $988 | $62,355 | $0 | $0 |
| 2019 | $1,017 | $60,953 | $0 | $0 |
| 2018 | $993 | $59,816 | $0 | $0 |
| 2017 | $957 | $58,586 | $0 | $0 |
| 2016 | $930 | $112,545 | $5,781 | $106,764 |
| 2015 | $922 | $95,792 | $4,216 | $91,576 |
| 2014 | $785 | $84,797 | $4,031 | $80,766 |
| 2013 | -- | $72,496 | $3,411 | $69,085 |
Source: Public Records
Map
Nearby Homes
- 3213 51st St W
- 3222 54th St W
- 3304 53rd St W
- 3108 53rd St W
- 3109 51st St W
- 3107 51st St W
- 3305 50th St W Unit 8
- 3307 50th St W
- 2811 53rd St W
- 3411 53rd St W
- 2621 53rd St W
- 2801 53rd St W
- 3222 53rd St W
- 3207 53rd St W
- 3115 53rd St W
- 3224 53rd St W
- 2822 52nd St W
- 3511 52nd St W
- 3003 52nd St W
- 3005 52nd St W
- 3209 53rd St W
- 3210 52nd St W
- 3217 53
- 3217 53rd St W
- 3216 53rd St W
- 3206 52nd St W
- 3208 53rd St W
- 3219 53rd St W
- 3206 53rd St W
- 3206 53rd St W Unit 10
- 3218 53rd St W
- 3218 52nd St W
- 3213 52nd St W
- 3221 53rd St W
- 3215 52nd St W
- 3220 53rd St W
- 3209 54th St W Unit 11
- 3209 54th St W
- 3209 52
- 3204 53rd St W