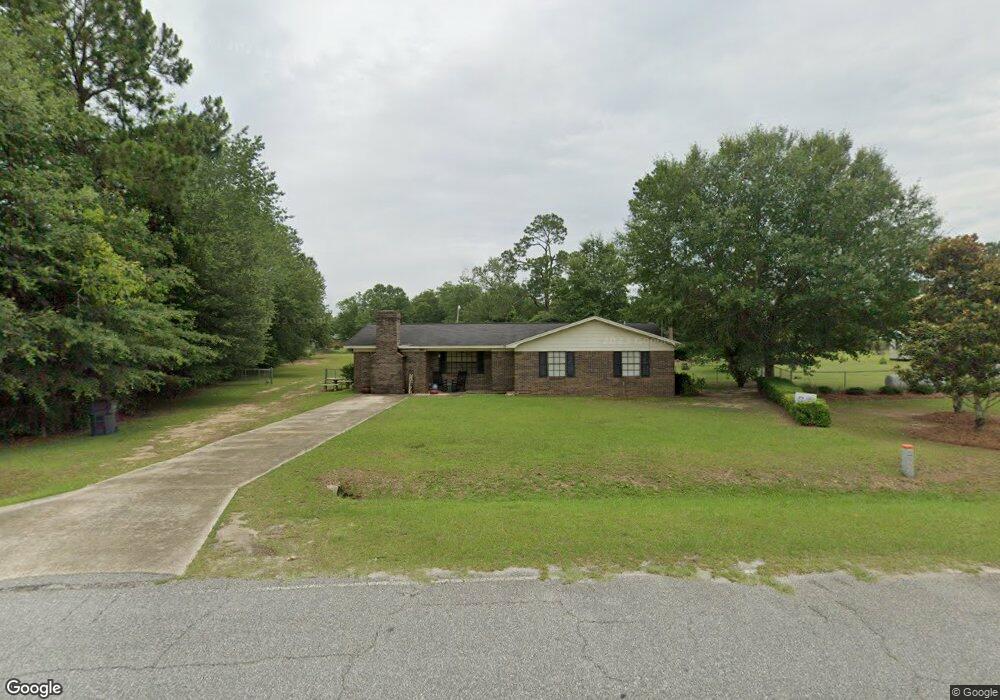
3213 Pinyon Dr Albany, GA 31721
Estimated Value: $146,134 - $181,000
3
Beds
2
Baths
1,565
Sq Ft
$104/Sq Ft
Est. Value
About This Home
This home is located at 3213 Pinyon Dr, Albany, GA 31721 and is currently estimated at $162,534, approximately $103 per square foot. 3213 Pinyon Dr is a home located in Dougherty County with nearby schools including Martin Luther King Jr. Elementary School, Southside Middle School, and Monroe High School.
Ownership History
Date
Name
Owned For
Owner Type
Purchase Details
Closed on
Nov 27, 2013
Sold by
Federal National Mortgage Association
Bought by
Hicks Mable A
Current Estimated Value
Home Financials for this Owner
Home Financials are based on the most recent Mortgage that was taken out on this home.
Original Mortgage
$38,165
Outstanding Balance
$28,435
Interest Rate
4.13%
Mortgage Type
New Conventional
Estimated Equity
$134,099
Purchase Details
Closed on
May 7, 2013
Sold by
Wooley Ross
Bought by
Bank Of America
Purchase Details
Closed on
Aug 1, 2005
Sold by
Buchannon H Ross
Bought by
Wooley H R
Purchase Details
Closed on
Aug 16, 2001
Sold by
Yancey James E
Bought by
Buchanan Melissa A and Ross Wooley H
Purchase Details
Closed on
Jan 15, 1997
Sold by
Anderson Richard F
Bought by
Yancey James E
Purchase Details
Closed on
Jun 25, 1981
Sold by
Cloverleaf Const Co
Bought by
Anderson Richard F
Create a Home Valuation Report for This Property
The Home Valuation Report is an in-depth analysis detailing your home's value as well as a comparison with similar homes in the area
Home Values in the Area
Average Home Value in this Area
Purchase History
| Date | Buyer | Sale Price | Title Company |
|---|---|---|---|
| Hicks Mable A | -- | -- | |
| Bank Of America | -- | -- | |
| Federal National Mtg Associati | -- | -- | |
| Wooley H R | -- | -- | |
| Buchanan Melissa A | $70,000 | -- | |
| Yancey James E | $68,000 | -- | |
| Anderson Richard F | -- | -- |
Source: Public Records
Mortgage History
| Date | Status | Borrower | Loan Amount |
|---|---|---|---|
| Open | Hicks Mable A | $38,165 |
Source: Public Records
Tax History Compared to Growth
Tax History
| Year | Tax Paid | Tax Assessment Tax Assessment Total Assessment is a certain percentage of the fair market value that is determined by local assessors to be the total taxable value of land and additions on the property. | Land | Improvement |
|---|---|---|---|---|
| 2024 | $1,693 | $36,636 | $4,800 | $31,836 |
| 2023 | $1,694 | $36,636 | $4,800 | $31,836 |
| 2022 | $1,698 | $36,636 | $4,800 | $31,836 |
| 2021 | $1,572 | $36,636 | $4,800 | $31,836 |
| 2020 | $1,574 | $36,636 | $4,800 | $31,836 |
| 2019 | $1,578 | $36,636 | $4,800 | $31,836 |
| 2018 | $1,582 | $36,636 | $4,800 | $31,836 |
| 2017 | $1,472 | $36,636 | $4,800 | $31,836 |
| 2016 | $1,473 | $36,636 | $4,800 | $31,836 |
| 2015 | $1,475 | $36,636 | $4,800 | $31,836 |
| 2014 | $1,455 | $36,636 | $4,800 | $31,836 |
Source: Public Records
Map
Nearby Homes
- 3108 Higgins Dr
- 3211 Higgins Dr
- 6413 Newton Rd
- 2610 North Ave
- 4200 Vanderbilt Dr
- 6224 Newton Rd
- 2613 Lonesome Rd
- 0000 Hamilton Dr
- 3710 Coakley Ave
- 3610 Slade Ave
- 1610 Lily Pond Rd
- 5407 Paulk Dr
- 5616 Newton Rd
- 5404 Paulk Dr
- 000 Lily Pond Rd
- 1503 Lily Pond Rd
- 3432 Aristedes Ct
- 2906 Barnaby Dr
- 2914 Barnaby Dr
- 2910 Barnaby Dr
- 3215 Pinyon Dr
- 3218 Pinyon Dr
- 3217 Pinyon Dr
- 3119 Higgins Dr
- 3207 Pinyon Dr
- 3121 Higgins Dr
- 3205 Pinyon Dr
- 3224 Pinyon Dr
- 3123 Higgins Dr
- 3113 Higgins Dr
- 3125 Higgins Dr
- 3111 Higgins Dr
- 0 Higgins Dr
- 3114 Higgins Dr
- 3225 Pinyon Dr
- 3127 Higgins Dr
- 3202 Pinyon Dr
- 3109 Higgins Dr
- 3201 Pinyon Dr
- 3107 Higgins Dr