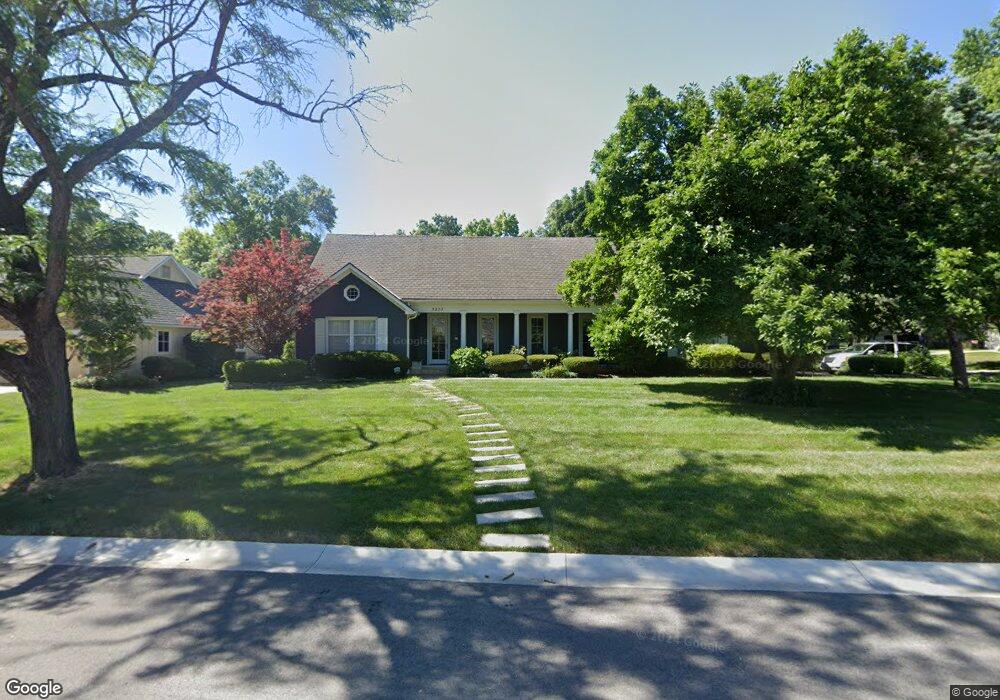
3213 W 84th Place Leawood, KS 66206
Estimated Value: $682,970 - $781,000
2
Beds
3
Baths
2,299
Sq Ft
$323/Sq Ft
Est. Value
About This Home
This home is located at 3213 W 84th Place, Leawood, KS 66206 and is currently estimated at $743,243, approximately $323 per square foot. 3213 W 84th Place is a home located in Johnson County with nearby schools including Indian Hills Middle School, Shawnee Mission East High School, and Highlawn Montessori School.
Ownership History
Date
Name
Owned For
Owner Type
Purchase Details
Closed on
May 28, 2009
Sold by
Jenkins James M and Jenkins Jenanne
Bought by
Jjenkins Revocable Trust
Current Estimated Value
Purchase Details
Closed on
Jun 11, 2004
Sold by
Jenkins James and Jenkins Jenanne
Bought by
Jenkins James M and Jenkins Jenanne
Purchase Details
Closed on
Oct 28, 2003
Sold by
Fairchild Robert C and Fairchild Patricia
Bought by
Jenkins James
Home Financials for this Owner
Home Financials are based on the most recent Mortgage that was taken out on this home.
Original Mortgage
$445,250
Outstanding Balance
$179,207
Interest Rate
4.12%
Mortgage Type
Stand Alone Second
Estimated Equity
$564,036
Purchase Details
Closed on
Jun 24, 2003
Sold by
Fairchild Charles W
Bought by
Fairchild Robert C and Robert C Fairchild Living Trust
Create a Home Valuation Report for This Property
The Home Valuation Report is an in-depth analysis detailing your home's value as well as a comparison with similar homes in the area
Home Values in the Area
Average Home Value in this Area
Purchase History
| Date | Buyer | Sale Price | Title Company |
|---|---|---|---|
| Jjenkins Revocable Trust | -- | None Available | |
| Jenkins James M | -- | -- | |
| Jenkins James | -- | Assured Quality Title Co | |
| Fairchild Robert C | -- | -- | |
| Fairchild Patricia | -- | -- |
Source: Public Records
Mortgage History
| Date | Status | Borrower | Loan Amount |
|---|---|---|---|
| Open | Jenkins James | $445,250 |
Source: Public Records
Tax History Compared to Growth
Tax History
| Year | Tax Paid | Tax Assessment Tax Assessment Total Assessment is a certain percentage of the fair market value that is determined by local assessors to be the total taxable value of land and additions on the property. | Land | Improvement |
|---|---|---|---|---|
| 2024 | $7,388 | $69,621 | $29,956 | $39,665 |
| 2023 | $7,887 | $73,703 | $27,240 | $46,463 |
| 2022 | $6,656 | $62,376 | $23,693 | $38,683 |
| 2021 | $6,456 | $58,098 | $23,693 | $34,405 |
| 2020 | $5,965 | $52,912 | $21,542 | $31,370 |
| 2019 | $5,658 | $50,336 | $21,542 | $28,794 |
| 2018 | $4,900 | $43,493 | $18,737 | $24,756 |
| 2017 | $4,801 | $41,952 | $17,026 | $24,926 |
| 2016 | $4,370 | $37,731 | $13,090 | $24,641 |
| 2015 | $4,354 | $37,892 | $13,090 | $24,802 |
| 2013 | -- | $37,076 | $13,090 | $23,986 |
Source: Public Records
Map
Nearby Homes
- 8605 Reinhardt Ln
- 3615 W 83rd Terrace
- 3004 W 83rd Terrace
- 3906 W 84th Terrace
- 3907 W 84th Terrace
- 3903 W 84th Terrace
- 3912 W 85th St
- 8728 Cherokee Ln
- 8514 Belinder Rd
- 8228 Ensley Ln
- 2816 W 87th Terrace
- 8324 Meadow Ln
- 8391 Somerset Dr
- 2815 W 82nd St
- 8429 Meadow Ln
- 8361 Somerset Dr Unit 303
- 8904 Cherokee Ln
- 8901 Mission Rd
- 8700 Lee Blvd
- 2508 W 88th St
- 3209 W 84th Place
- 8501 Reinhardt Ln
- 8419 Reinhardt Ln
- 8426 Reinhardt Ln
- 3208 W 84th Place
- 3205 W 84th Place
- 3204 W 84th Place
- 8500 Reinhardt Ln
- 8418 Reinhardt Ln
- 8505 Reinhardt Ln
- 8415 Reinhardt Ln
- 3201 W 84th Place
- 8417 Reinhardt St
- 8502 Cherokee Place
- 8504 Reinhardt Ln
- 8425 Reinhardt St
- 8412 Wenonga Rd
- 3200 W 84th Place
- 8408 Wenonga Rd
- 8409 Reinhardt Ln