3214 Via de Canto Carlsbad, CA 92010
Tamarack Point NeighborhoodEstimated Value: $775,000 - $999,000
3
Beds
3
Baths
1,496
Sq Ft
$571/Sq Ft
Est. Value
About This Home
This home is located at 3214 Via de Canto, Carlsbad, CA 92010 and is currently estimated at $854,758, approximately $571 per square foot. 3214 Via de Canto is a home located in San Diego County with nearby schools including Buena Vista Elementary, Carlsbad High School, and Sage Creek High.
Ownership History
Date
Name
Owned For
Owner Type
Purchase Details
Closed on
Jul 30, 2020
Sold by
Nishimoto Stephen J
Bought by
Nishimoto Stephen Joji and The Stephen Joji Nishimoto Tru
Current Estimated Value
Purchase Details
Closed on
Jul 15, 1998
Sold by
Spencer Katharine M
Bought by
Spencer David J
Home Financials for this Owner
Home Financials are based on the most recent Mortgage that was taken out on this home.
Original Mortgage
$122,000
Outstanding Balance
$24,750
Interest Rate
6.9%
Estimated Equity
$830,008
Purchase Details
Closed on
Jul 13, 1998
Sold by
Spencer David J
Bought by
Nishimoto Stephen J
Home Financials for this Owner
Home Financials are based on the most recent Mortgage that was taken out on this home.
Original Mortgage
$122,000
Outstanding Balance
$24,750
Interest Rate
6.9%
Estimated Equity
$830,008
Purchase Details
Closed on
Oct 12, 1995
Sold by
Spencer David J and Spencer Cynthia
Bought by
Spencer David J
Create a Home Valuation Report for This Property
The Home Valuation Report is an in-depth analysis detailing your home's value as well as a comparison with similar homes in the area
Home Values in the Area
Average Home Value in this Area
Purchase History
| Date | Buyer | Sale Price | Title Company |
|---|---|---|---|
| Nishimoto Stephen Joji | -- | None Available | |
| Spencer David J | -- | Southland Title | |
| Nishimoto Stephen J | $152,500 | Southland Title | |
| Spencer David J | -- | -- |
Source: Public Records
Mortgage History
| Date | Status | Borrower | Loan Amount |
|---|---|---|---|
| Open | Nishimoto Stephen J | $122,000 |
Source: Public Records
Tax History
| Year | Tax Paid | Tax Assessment Tax Assessment Total Assessment is a certain percentage of the fair market value that is determined by local assessors to be the total taxable value of land and additions on the property. | Land | Improvement |
|---|---|---|---|---|
| 2025 | $2,466 | $239,046 | $47,845 | $191,201 |
| 2024 | $2,466 | $234,359 | $46,907 | $187,452 |
| 2023 | $2,451 | $229,765 | $45,988 | $183,777 |
| 2022 | $2,411 | $225,261 | $45,087 | $180,174 |
| 2021 | $2,392 | $220,845 | $44,203 | $176,642 |
| 2020 | $2,375 | $218,581 | $43,750 | $174,831 |
| 2019 | $2,332 | $214,296 | $42,893 | $171,403 |
| 2018 | $2,232 | $210,095 | $42,052 | $168,043 |
| 2017 | $90 | $205,977 | $41,228 | $164,749 |
| 2016 | $2,104 | $201,939 | $40,420 | $161,519 |
| 2015 | $2,095 | $198,906 | $39,813 | $159,093 |
| 2014 | $2,059 | $195,011 | $39,034 | $155,977 |
Source: Public Records
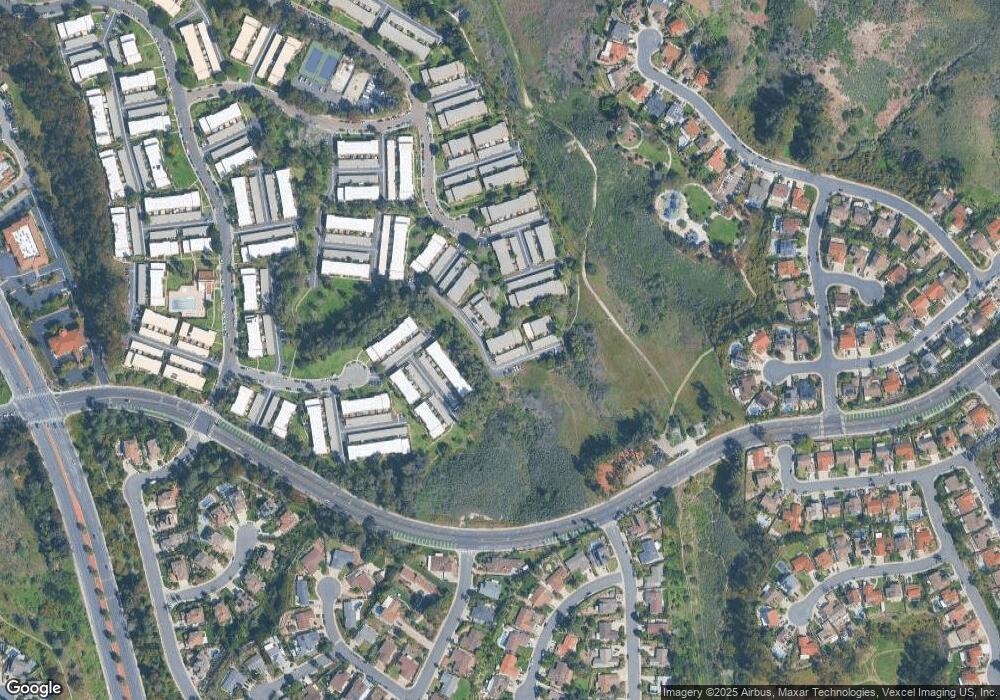
Map
Nearby Homes
- 3201 Via Pescado
- 2925 Via Libertad
- 2334 Kimberly Ct
- 2726 Naples Ct
- 2380 Hosp Way Unit 139
- 3492 Corvallis St
- 3354 Seacrest Dr
- 2360 Hosp Way Unit 331
- 2330 Hosp Way Unit 202
- 2336 Hosp Way Unit 115
- 2336 Hosp Way Unit 314
- 2332 Hosp Way Unit 207
- 3072 Marron Rd
- 2360 Paseo de Laura Unit 2
- 2360 Paseo de Laura Unit 1
- 3810 Sierra Morena Ave
- 3235 Donna Dr
- 2622 Half Dome Place
- 3122 Salina Rd
- 2808 Winthrop Ave
- 3212 Via de Canto
- 3216 Via de Canto
- 3218 Via de Canto Unit 1
- 3220 Via de Canto
- 3210 Via de Canto
- 3208 Via de Canto
- 3222 Via de Canto
- 3206 Via de Canto
- 3224 Via de Canto
- 3204 Via de Canto
- 3226 Via de Canto
- 3202 Via de Canto
- 3214 Via Pescado
- 3212 Via Pescado
- 3216 Via Pescado
- 3210 Via Pescado
- 2803 Via Topacio
- 3228 Via de Canto
- 3218 Via Pescado
- 3208 Via Pescado
Your Personal Tour Guide
Ask me questions while you tour the home.