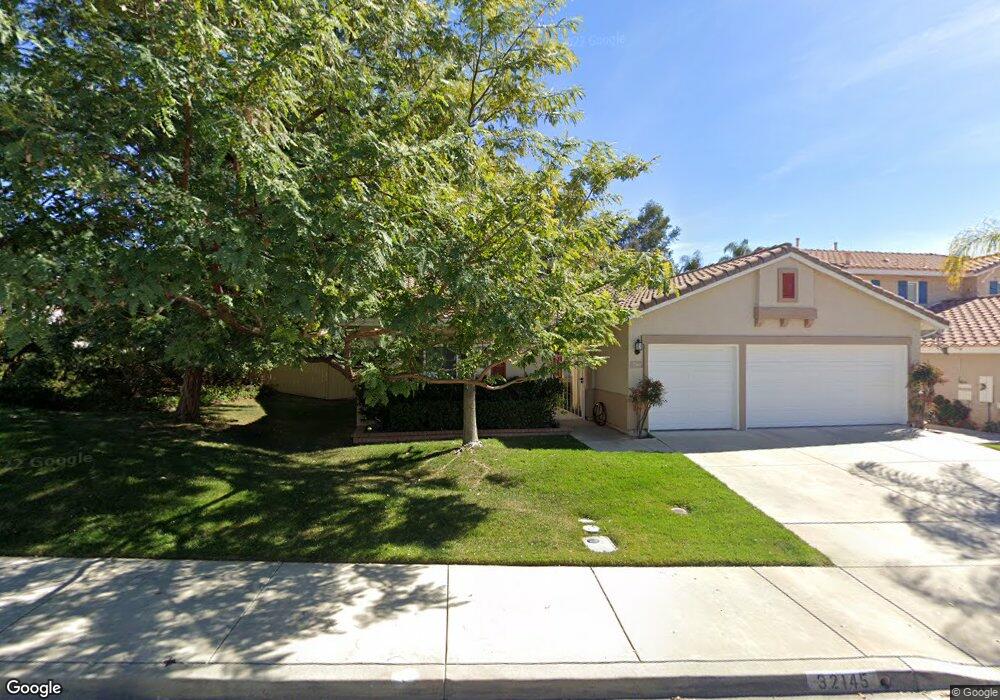
32145 Corte Del Cerro Temecula, CA 92592
Margarita Village-Temeku Hills NeighborhoodEstimated Value: $768,860 - $809,000
4
Beds
3
Baths
2,415
Sq Ft
$330/Sq Ft
Est. Value
About This Home
This home is located at 32145 Corte Del Cerro, Temecula, CA 92592 and is currently estimated at $797,965, approximately $330 per square foot. 32145 Corte Del Cerro is a home located in Riverside County with nearby schools including Vintage Hills Elementary School, Temecula Middle School, and Temecula Valley High School.
Ownership History
Date
Name
Owned For
Owner Type
Purchase Details
Closed on
Oct 6, 1998
Sold by
Bucci Anthony J and Bucci Donna L
Bought by
Bucci Anthony J and Bucci Donna L
Current Estimated Value
Purchase Details
Closed on
Mar 24, 1998
Sold by
Mcneely George G and Mcneely Karen C
Bought by
Bucci Anthony J and Bucci Donna L
Home Financials for this Owner
Home Financials are based on the most recent Mortgage that was taken out on this home.
Original Mortgage
$154,000
Outstanding Balance
$28,272
Interest Rate
7.06%
Estimated Equity
$769,693
Purchase Details
Closed on
Aug 22, 1996
Sold by
Taylor Woodrow Hms Ca
Bought by
Mcneely George B and Mcneely Karen C
Home Financials for this Owner
Home Financials are based on the most recent Mortgage that was taken out on this home.
Original Mortgage
$166,200
Interest Rate
7.12%
Purchase Details
Closed on
Mar 7, 1995
Sold by
Tayco
Bought by
Taylor Woodrow Homes California Ltd
Create a Home Valuation Report for This Property
The Home Valuation Report is an in-depth analysis detailing your home's value as well as a comparison with similar homes in the area
Home Values in the Area
Average Home Value in this Area
Purchase History
| Date | Buyer | Sale Price | Title Company |
|---|---|---|---|
| Bucci Anthony J | -- | -- | |
| Bucci Anthony J | $192,500 | Old Republic Title Company | |
| Mcneely George B | $175,000 | First American Title Ins Co | |
| Taylor Woodrow Homes California Ltd | -- | First American Title Ins Co |
Source: Public Records
Mortgage History
| Date | Status | Borrower | Loan Amount |
|---|---|---|---|
| Open | Bucci Anthony J | $154,000 | |
| Previous Owner | Mcneely George B | $166,200 |
Source: Public Records
Tax History
| Year | Tax Paid | Tax Assessment Tax Assessment Total Assessment is a certain percentage of the fair market value that is determined by local assessors to be the total taxable value of land and additions on the property. | Land | Improvement |
|---|---|---|---|---|
| 2025 | $3,817 | $307,334 | $63,848 | $243,486 |
| 2023 | $3,817 | $295,402 | $61,370 | $234,032 |
| 2022 | $3,695 | $289,611 | $60,167 | $229,444 |
| 2021 | $3,615 | $283,934 | $58,988 | $224,946 |
| 2020 | $3,574 | $281,024 | $58,384 | $222,640 |
| 2019 | $3,521 | $275,515 | $57,240 | $218,275 |
| 2018 | $3,449 | $270,114 | $56,118 | $213,996 |
| 2017 | $3,387 | $264,818 | $55,018 | $209,800 |
| 2016 | $3,639 | $259,627 | $53,940 | $205,687 |
| 2015 | $3,668 | $255,730 | $53,131 | $202,599 |
| 2014 | $3,815 | $250,723 | $52,092 | $198,631 |
Source: Public Records
Map
Nearby Homes
- 32249 Chemin Laurent
- 31903 Vineyard Ave
- 31852 Corte Montecito
- 41284 Promenade Chardonnay Hills
- 38100 Pauba Rd
- 42351 Gronlund Ct
- 32284 Placer Belair
- 0 Green Tree Rd Unit 178 250037799
- 0 Pauba Rd Unit OC25223195
- 41614 Zinfandel Ave
- 32856 Northshire Cir
- 31772 Corte Rosario
- 41570 Avenida Bordeaux
- 42545 Lyles Dr
- 41309 Avenida Biona
- 32179 Cala Torrente
- 32163 Cala Torrente
- 41657 Cypress Point Way
- 41686 Monterey Place
- 41087 Promenade Chardonnay Hills
- 32133 Corte Del Cerro
- 32121 Corte Del Cerro
- 41910 Via Vasquez
- 41763 Camino de la Torre
- 41800 Via Vasquez
- 32109 Corte Canel
- 41775 Camino de la Torre
- 32146 Corte Del Cerro
- 32158 Corte Del Cerro
- 32134 Corte Del Cerro
- 41787 Camino de la Torre
- 41810 Via Vasquez
- 32207 Corte Del Cerro
- 32170 Corte Del Cerro
- 32122 Corte Del Cerro
- 32097 Corte Canel
- 32182 Corte Del Cerro
- 41799 Camino de la Torre
- 32219 Corte Del Cerro
- 32194 Corte Del Cerro
Your Personal Tour Guide
Ask me questions while you tour the home.