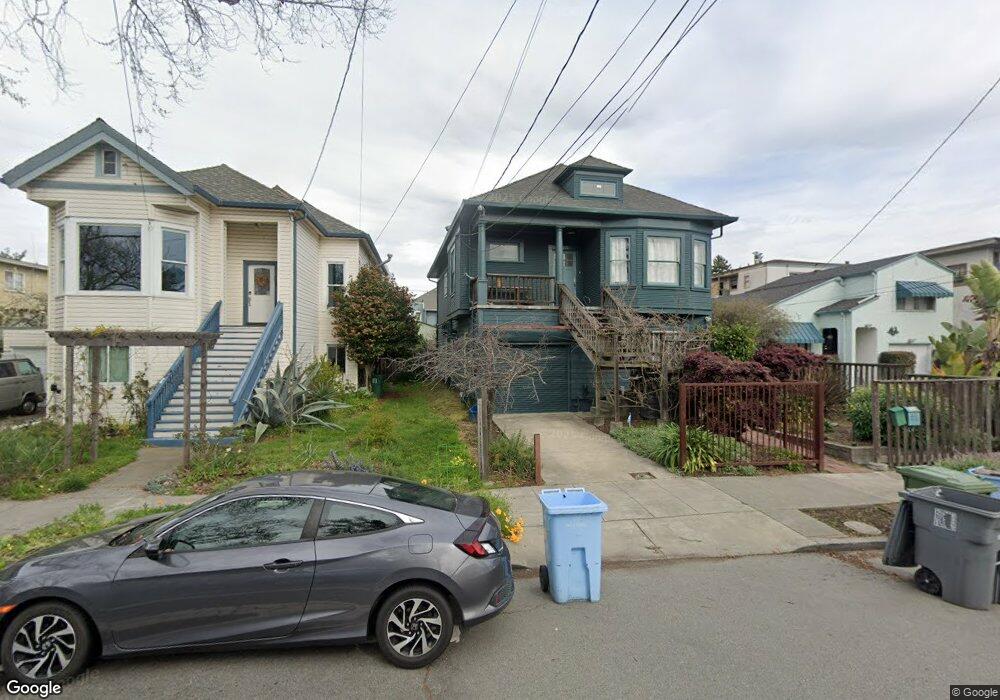
3215 King St Berkeley, CA 94703
South Berkeley NeighborhoodEstimated Value: $864,000 - $1,637,000
4
Beds
3
Baths
2,485
Sq Ft
$477/Sq Ft
Est. Value
About This Home
This home is located at 3215 King St, Berkeley, CA 94703 and is currently estimated at $1,186,062, approximately $477 per square foot. 3215 King St is a home located in Alameda County with nearby schools including Malcolm X Elementary School, Emerson Elementary School, and John Muir Elementary School.
Ownership History
Date
Name
Owned For
Owner Type
Purchase Details
Closed on
Feb 26, 2007
Sold by
Oliver Merritt G and Levine Merritt G
Bought by
Oliver Schuyler and Oliver Merritt G
Current Estimated Value
Purchase Details
Closed on
Apr 3, 1996
Sold by
Canada Robert and Canada William
Bought by
Levine Merritt G
Home Financials for this Owner
Home Financials are based on the most recent Mortgage that was taken out on this home.
Original Mortgage
$60,000
Outstanding Balance
$2,840
Interest Rate
7.41%
Estimated Equity
$1,183,222
Create a Home Valuation Report for This Property
The Home Valuation Report is an in-depth analysis detailing your home's value as well as a comparison with similar homes in the area
Home Values in the Area
Average Home Value in this Area
Purchase History
| Date | Buyer | Sale Price | Title Company |
|---|---|---|---|
| Oliver Schuyler | -- | Old Republic Title Company | |
| Levine Merritt G | $75,000 | First American Title Guarant |
Source: Public Records
Mortgage History
| Date | Status | Borrower | Loan Amount |
|---|---|---|---|
| Open | Levine Merritt G | $60,000 |
Source: Public Records
Tax History
| Year | Tax Paid | Tax Assessment Tax Assessment Total Assessment is a certain percentage of the fair market value that is determined by local assessors to be the total taxable value of land and additions on the property. | Land | Improvement |
|---|---|---|---|---|
| 2025 | $8,388 | $214,990 | $37,376 | $177,614 |
| 2024 | $8,388 | $210,775 | $36,643 | $174,132 |
| 2023 | $8,544 | $206,642 | $35,924 | $170,718 |
| 2022 | $8,762 | $202,591 | $35,220 | $167,371 |
| 2021 | $8,299 | $198,620 | $34,530 | $164,090 |
| 2020 | $7,697 | $196,584 | $34,176 | $162,408 |
| 2019 | $7,195 | $192,730 | $33,506 | $159,224 |
| 2018 | $6,985 | $188,951 | $32,849 | $156,102 |
| 2017 | $6,718 | $185,247 | $32,205 | $153,042 |
| 2016 | $6,323 | $181,616 | $31,574 | $150,042 |
| 2015 | $6,106 | $178,888 | $31,099 | $147,789 |
| 2014 | $6,054 | $175,385 | $30,490 | $144,895 |
Source: Public Records
Map
Nearby Homes
- 3233 Ellis St
- 3214 California St
- 3138 California St
- 3114 California St
- 3110 California St
- 3224 Sacramento St
- 1646 Ashby Ave
- 3101 Sacramento St
- 1507 Prince St
- 6015 Adeline St
- 2926 Ellis St
- 968 62nd St
- 5914 Martin Luther King jr Way
- 6555 Shattuck Ave
- 1535 Julia St
- 6300 Shattuck Ave Unit 1
- 6320 Shattuck Ave
- 667 & 667A Alcatraz Ave
- 667 Alcatraz Ave
- 2922 Stanton St
Your Personal Tour Guide
Ask me questions while you tour the home.