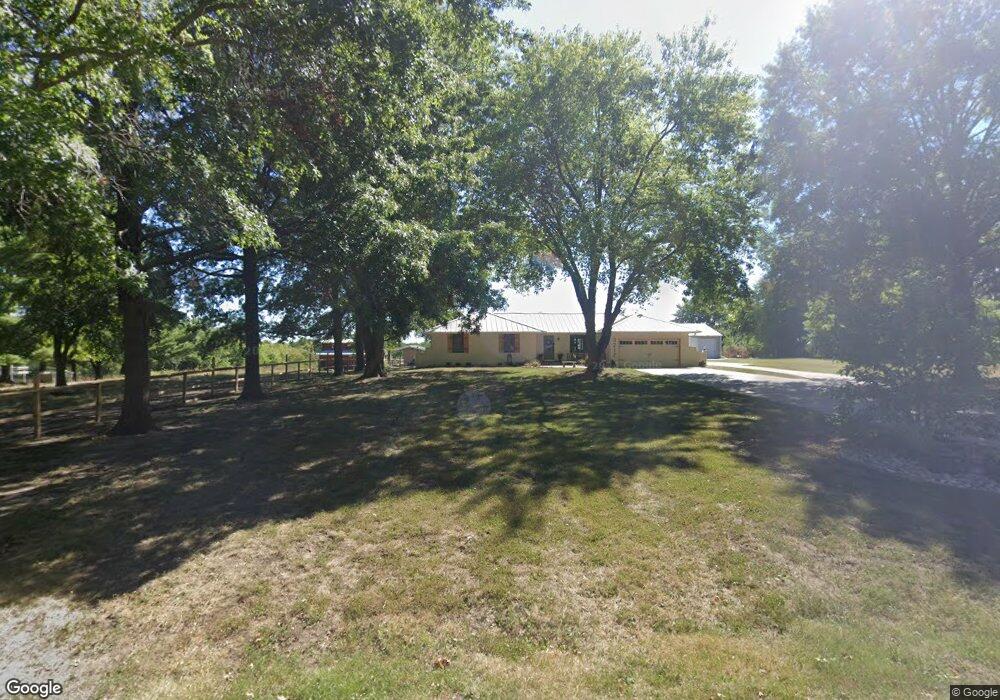
3215 S Bellechase Dr Grain Valley, MO 64029
Estimated Value: $461,958 - $526,000
3
Beds
3
Baths
2,104
Sq Ft
$239/Sq Ft
Est. Value
About This Home
This home is located at 3215 S Bellechase Dr, Grain Valley, MO 64029 and is currently estimated at $502,319, approximately $238 per square foot. 3215 S Bellechase Dr is a home located in Jackson County with nearby schools including Grain Valley High School.
Ownership History
Date
Name
Owned For
Owner Type
Purchase Details
Closed on
Sep 29, 2005
Sold by
Knisley Ronald W
Bought by
Hull Jeremy
Current Estimated Value
Home Financials for this Owner
Home Financials are based on the most recent Mortgage that was taken out on this home.
Original Mortgage
$185,600
Outstanding Balance
$103,315
Interest Rate
6.5%
Mortgage Type
Fannie Mae Freddie Mac
Estimated Equity
$399,004
Purchase Details
Closed on
Mar 19, 2001
Sold by
Ricketts Jay M and Ricketts Maya Jane
Bought by
Knisley Ronald W
Home Financials for this Owner
Home Financials are based on the most recent Mortgage that was taken out on this home.
Original Mortgage
$192,000
Interest Rate
7.1%
Mortgage Type
Purchase Money Mortgage
Purchase Details
Closed on
Aug 16, 1995
Sold by
Birch Norman and Birch Helen
Bought by
Ricketts Jay M and Ricketts Maya Jane
Home Financials for this Owner
Home Financials are based on the most recent Mortgage that was taken out on this home.
Original Mortgage
$102,000
Interest Rate
7.59%
Mortgage Type
Purchase Money Mortgage
Create a Home Valuation Report for This Property
The Home Valuation Report is an in-depth analysis detailing your home's value as well as a comparison with similar homes in the area
Home Values in the Area
Average Home Value in this Area
Purchase History
| Date | Buyer | Sale Price | Title Company |
|---|---|---|---|
| Hull Jeremy | -- | First American Title Ins Co | |
| Knisley Ronald W | -- | Chicago Title Co | |
| Ricketts Jay M | -- | -- |
Source: Public Records
Mortgage History
| Date | Status | Borrower | Loan Amount |
|---|---|---|---|
| Open | Hull Jeremy | $185,600 | |
| Previous Owner | Knisley Ronald W | $192,000 | |
| Previous Owner | Ricketts Jay M | $102,000 |
Source: Public Records
Tax History Compared to Growth
Tax History
| Year | Tax Paid | Tax Assessment Tax Assessment Total Assessment is a certain percentage of the fair market value that is determined by local assessors to be the total taxable value of land and additions on the property. | Land | Improvement |
|---|---|---|---|---|
| 2025 | $3,899 | $62,126 | $19,657 | $42,469 |
| 2024 | $3,899 | $55,944 | $21,029 | $34,915 |
| 2023 | $3,765 | $55,943 | $12,988 | $42,955 |
| 2022 | $3,701 | $49,780 | $16,183 | $33,597 |
| 2021 | $3,611 | $49,780 | $16,183 | $33,597 |
| 2020 | $3,349 | $43,681 | $16,183 | $27,498 |
| 2019 | $3,166 | $43,681 | $16,183 | $27,498 |
| 2018 | $2,824 | $38,016 | $14,084 | $23,932 |
| 2017 | $2,749 | $38,016 | $14,084 | $23,932 |
| 2016 | $2,749 | $37,064 | $8,367 | $28,697 |
| 2014 | $2,760 | $37,064 | $8,367 | $28,697 |
Source: Public Records
Map
Nearby Homes
- 33412 Pinehurst Ln
- 3602 S Sweeney Rd
- 33400 E Truman Rd
- 3316 S Gardner Rd
- 36011 E Gardner Rd
- 32810 E Perry Rd
- 36605 E Pink Hill Rd
- 912 NW Hickorywood Dr
- 408 NW Rust Ct
- TBD E Duncan Rd
- 809 NW Poplar Ct
- 1800 NW Mya Ct
- 1415 NE Jaclyn Dr
- 401 NW Europa Dr
- 952 NW Maplewood Ct
- 1103 NW Hickory Ct
- 2211 NW Hedgewood Dr
- 1515 S Buckner Tarsney (Bb) Rd
- 2003 NW Elmwood Dr
- 1702 NW Hedgewood Dr
- 3216 S Bellechase Dr
- 3305 S Bellechase Dr
- 3304 S Bellechase Dr
- 3207 S Bellechase Dr
- 3317 S Bellechase Dr
- 3318 S Bellechase Dr
- 3200 S Bellechase Dr
- 3406 S Bellechase Dr
- 34112 E Pink Hill Rd
- 34206 E Pink Hill Rd
- 34212 E Pink Hill Rd
- 34104 E Pink Hill Rd
- 34308 E Pink Hill Rd
- 34010 E Pink Hill Rd
- 34004 E Pink Hill Rd
- 34406 E Pink Hill Rd
- 34307 E Pink Hill Rd
- 34209 E Pink Hill Rd
- 34203 E Pink Hill Rd
- 34503 E Pink Hill Rd