Estimated Value: $692,000 - $768,000
4
Beds
3
Baths
3,523
Sq Ft
$205/Sq Ft
Est. Value
About This Home
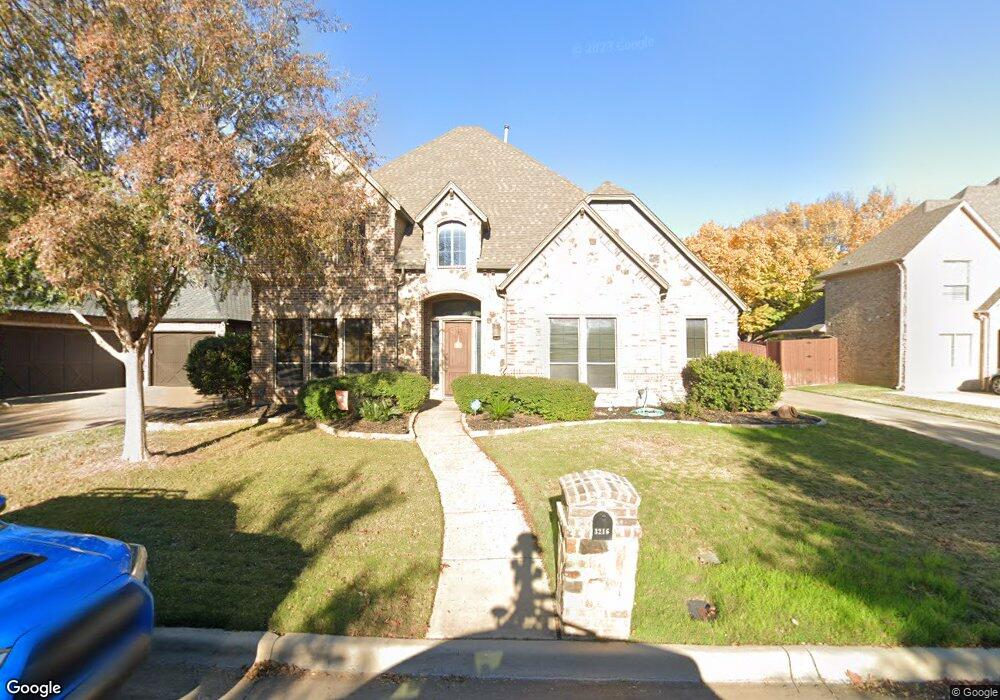
This home is located at 3216 Glade Pointe Ct, Hurst, TX 76054 and is currently estimated at $723,508, approximately $205 per square foot. 3216 Glade Pointe Ct is a home located in Tarrant County with nearby schools including W.A. Porter Elementary School, Smithfield Middle School, and Birdville High School.
Ownership History
Date
Name
Owned For
Owner Type
Purchase Details
Closed on
Feb 16, 2012
Sold by
Azul Group Inc
Bought by
Bradley Mark K and Bradley Jodi F
Current Estimated Value
Home Financials for this Owner
Home Financials are based on the most recent Mortgage that was taken out on this home.
Original Mortgage
$271,920
Outstanding Balance
$33,089
Interest Rate
3.95%
Mortgage Type
New Conventional
Estimated Equity
$690,419
Purchase Details
Closed on
Oct 20, 2011
Sold by
Hanshaw William M
Bought by
Azul Group Inc
Purchase Details
Closed on
Jun 9, 2006
Sold by
Ambiance Custom Homes
Bought by
Hanshaw William M
Home Financials for this Owner
Home Financials are based on the most recent Mortgage that was taken out on this home.
Original Mortgage
$417,000
Interest Rate
6.58%
Mortgage Type
Fannie Mae Freddie Mac
Create a Home Valuation Report for This Property
The Home Valuation Report is an in-depth analysis detailing your home's value as well as a comparison with similar homes in the area
Home Values in the Area
Average Home Value in this Area
Purchase History
| Date | Buyer | Sale Price | Title Company |
|---|---|---|---|
| Bradley Mark K | -- | None Available | |
| Azul Group Inc | -- | None Available | |
| Hanshaw William M | -- | Commonwealth Land |
Source: Public Records
Mortgage History
| Date | Status | Borrower | Loan Amount |
|---|---|---|---|
| Open | Bradley Mark K | $271,920 | |
| Previous Owner | Hanshaw William M | $417,000 |
Source: Public Records
Tax History Compared to Growth
Tax History
| Year | Tax Paid | Tax Assessment Tax Assessment Total Assessment is a certain percentage of the fair market value that is determined by local assessors to be the total taxable value of land and additions on the property. | Land | Improvement |
|---|---|---|---|---|
| 2025 | $11,551 | $615,000 | $84,150 | $530,850 |
| 2024 | $11,551 | $662,495 | $84,150 | $578,345 |
| 2023 | $12,744 | $698,764 | $84,150 | $614,614 |
| 2022 | $12,534 | $506,939 | $84,150 | $422,789 |
| 2021 | $12,322 | $475,000 | $90,000 | $385,000 |
| 2020 | $12,207 | $475,000 | $90,000 | $385,000 |
| 2019 | $13,779 | $526,086 | $90,000 | $436,086 |
| 2018 | $11,610 | $476,581 | $90,000 | $386,581 |
| 2017 | $13,167 | $524,443 | $90,000 | $434,443 |
| 2016 | $11,970 | $504,144 | $70,000 | $434,144 |
| 2015 | $10,229 | $407,800 | $45,000 | $362,800 |
| 2014 | $10,229 | $407,800 | $45,000 | $362,800 |
Source: Public Records
Map
Nearby Homes
- 3208 Glade Pointe Ct
- 3132 Hurstview Dr
- 3228 Oakdale Dr
- 3412 Glade Creek Dr
- 716 Bridget Way
- 3229 David Dr
- 3233 David Dr
- 717 Reese Ln
- 3309 Texas Trail Ct
- 713 Paul Dr
- 405 Bremen Dr
- 312 Bremen Dr
- 3317 S Riley Ct
- 712 Bear Creek Dr
- 621 Trails End Ct
- 2829 Sandstone Dr
- 716 Bear Creek Dr
- 713 Corsair Ct
- 2844 Hurstview Dr
- 2809 Sandstone Dr
- 3220 Glade Pointe Ct
- 3212 Glade Pointe Ct
- 713 W Glade Rd
- 709 W Glade Rd
- 717 W Glade Rd
- 3221 Glade Pointe Ct
- 3217 Glade Pointe Ct
- 3213 Glade Pointe Ct
- 3204 Glade Pointe Ct
- 721 W Glade Rd
- 3229 Glade Pointe Ct
- 3209 Glade Pointe Ct
- 3245 River Bend Dr
- 3243 River Bend Dr
- 3247 River Bend Dr
- 3241 River Bend Dr
- 3300 Glade Creek Dr
- 3200 Glade Pointe Ct
- 3249 River Bend Dr
- 3233 Glade Pointe Ct