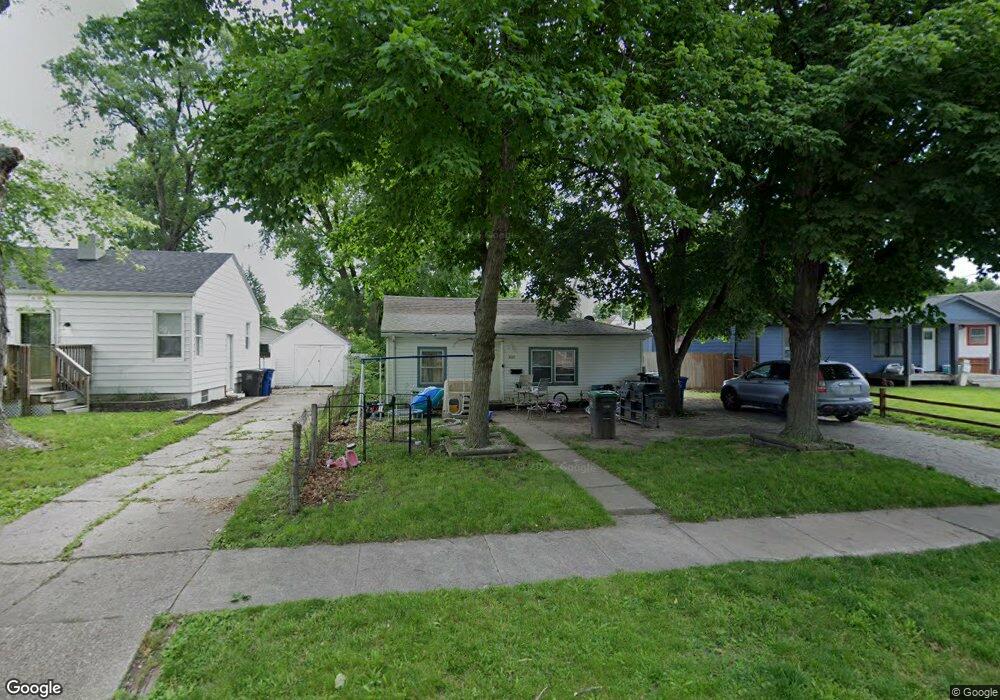
3217 Amherst St Des Moines, IA 50313
Highland Park NeighborhoodEstimated Value: $134,479 - $190,000
3
Beds
1
Bath
1,080
Sq Ft
$147/Sq Ft
Est. Value
About This Home
This home is located at 3217 Amherst St, Des Moines, IA 50313 and is currently estimated at $158,370, approximately $146 per square foot. 3217 Amherst St is a home located in Polk County with nearby schools including Findley Elementary School, Harding Middle School, and North High School.
Ownership History
Date
Name
Owned For
Owner Type
Purchase Details
Closed on
Mar 29, 2002
Sold by
Nations Credit Financial Services Corp
Bought by
Oeth Gary
Current Estimated Value
Purchase Details
Closed on
Mar 22, 2001
Sold by
Reszel Andrew and Reszel Constance A
Bought by
Nations Credit Financial Services Corp
Purchase Details
Closed on
Apr 15, 1998
Sold by
Contract Exchange Corp
Bought by
Mid Ohio Securities Corp and Larkin Michael J
Purchase Details
Closed on
Apr 9, 1998
Sold by
Cash Consultants L L C
Bought by
Contract Exchange Corp
Purchase Details
Closed on
Feb 10, 1998
Sold by
Cash Consultants L L C
Bought by
Reszel Andrew H
Purchase Details
Closed on
Feb 8, 1998
Sold by
Northern Investors Inc
Bought by
Cash Consultants Llc
Purchase Details
Closed on
Mar 18, 1997
Sold by
Duin Lee U
Bought by
Northern Investors Inc
Purchase Details
Closed on
Feb 10, 1997
Sold by
Thoren Elmer
Bought by
Cash Consultants L L C
Create a Home Valuation Report for This Property
The Home Valuation Report is an in-depth analysis detailing your home's value as well as a comparison with similar homes in the area
Home Values in the Area
Average Home Value in this Area
Purchase History
| Date | Buyer | Sale Price | Title Company |
|---|---|---|---|
| Oeth Gary | $19,500 | -- | |
| Nations Credit Financial Services Corp | $13,900 | -- | |
| Mid Ohio Securities Corp | -- | -- | |
| Contract Exchange Corp | -- | -- | |
| Reszel Andrew H | $24,500 | -- | |
| Cash Consultants Llc | -- | -- | |
| Northern Investors Inc | -- | -- | |
| Cash Consultants L L C | -- | -- |
Source: Public Records
Tax History Compared to Growth
Tax History
| Year | Tax Paid | Tax Assessment Tax Assessment Total Assessment is a certain percentage of the fair market value that is determined by local assessors to be the total taxable value of land and additions on the property. | Land | Improvement |
|---|---|---|---|---|
| 2025 | $1,650 | $96,300 | $29,700 | $66,600 |
| 2024 | $1,650 | $83,900 | $25,700 | $58,200 |
| 2023 | $1,550 | $83,900 | $25,700 | $58,200 |
| 2022 | $1,538 | $65,800 | $20,500 | $45,300 |
| 2021 | $1,438 | $65,800 | $20,500 | $45,300 |
| 2020 | $1,494 | $57,600 | $18,100 | $39,500 |
| 2019 | $1,370 | $57,600 | $18,100 | $39,500 |
| 2018 | $1,356 | $51,000 | $16,000 | $35,000 |
| 2017 | $1,358 | $51,000 | $16,000 | $35,000 |
| 2016 | $1,322 | $50,200 | $14,600 | $35,600 |
| 2015 | $1,322 | $50,200 | $14,600 | $35,600 |
| 2014 | $1,292 | $48,600 | $13,700 | $34,900 |
Source: Public Records
Map
Nearby Homes
- 3210 E 7th St
- 3120 Amherst St
- 3421 Amherst St
- 3409 Bowdoin St
- 3215 E 8th St
- 414 E Ovid Ave
- 3301 Columbia St
- 3507 Bowdoin St
- 3007 E 8th St
- 3701 Amherst St
- 3007 Cornell St
- 816 Boyd St
- 3704 Wright St
- 3623 Wright St
- 2818 Bowdoin St
- 3308 Cambridge St
- 3416 Cambridge St
- 3723 Wright St
- 3623 Cambridge St
- 3823 Bowdoin St
- 3221 Amherst St
- 3215 Amherst St
- 3301 Amherst St
- 3213 Amherst St
- 3216 N Union St
- 3305 Amherst St
- 3211 Amherst St
- 3212 N Union St
- 3220 N Union St
- 3224 N Union St
- 3208 N Union St
- 3218 Amherst St
- 3220 Amherst St
- 3214 Amherst St
- 3309 Amherst St
- 3201 Amherst St
- 3300 Amherst St
- 3210 Amherst St
- 3204 N Union St
- 3228 N Union St