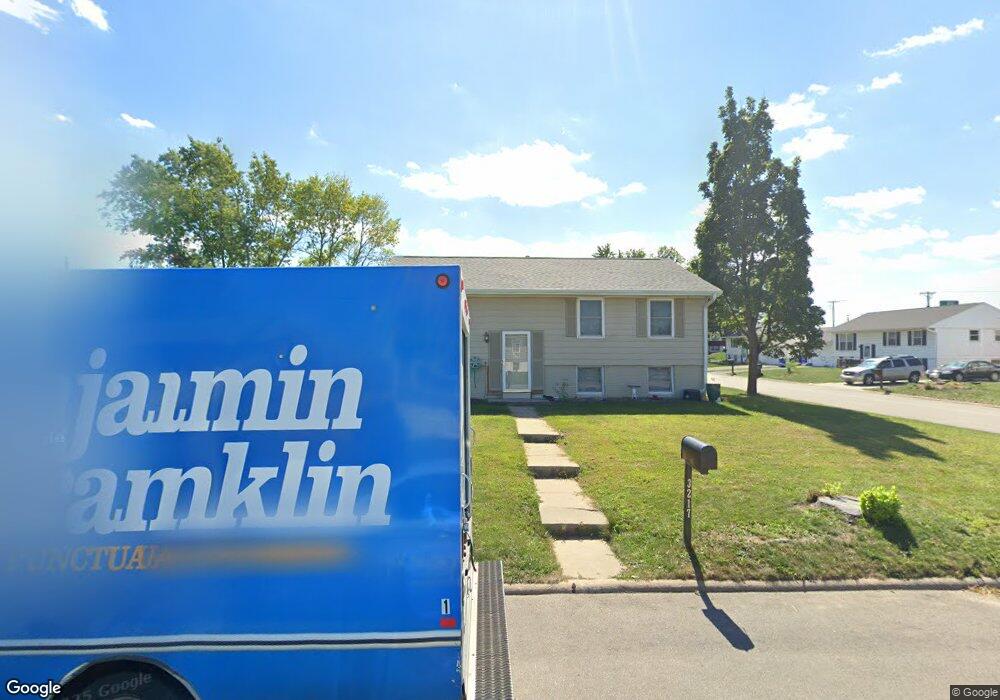
3217 Pebble Dr SW Cedar Rapids, IA 52404
Estimated Value: $196,000 - $221,000
4
Beds
3
Baths
894
Sq Ft
$235/Sq Ft
Est. Value
About This Home
This home is located at 3217 Pebble Dr SW, Cedar Rapids, IA 52404 and is currently estimated at $210,363, approximately $235 per square foot. 3217 Pebble Dr SW is a home located in Linn County with nearby schools including Prairie Crest Elementary School, Prairie View Elementary School, and Prairie Ridge Elementary School.
Ownership History
Date
Name
Owned For
Owner Type
Purchase Details
Closed on
May 25, 2004
Sold by
Elkeurti Omar and Elkeurti Karima
Bought by
Myers Amanda L and Scott Matthew L
Current Estimated Value
Home Financials for this Owner
Home Financials are based on the most recent Mortgage that was taken out on this home.
Original Mortgage
$119,000
Outstanding Balance
$51,846
Interest Rate
4.5%
Mortgage Type
Unknown
Estimated Equity
$158,517
Purchase Details
Closed on
Jun 28, 2002
Sold by
Hajek Robert D and Hajek Julie M
Bought by
Elkeurti Omar and Elkeurti Karima
Home Financials for this Owner
Home Financials are based on the most recent Mortgage that was taken out on this home.
Original Mortgage
$109,250
Interest Rate
6.93%
Purchase Details
Closed on
Jan 27, 1999
Sold by
Rogers Randall A and Rogers Debra L
Bought by
Hajek Robert O and Hajek Julie M
Home Financials for this Owner
Home Financials are based on the most recent Mortgage that was taken out on this home.
Original Mortgage
$83,000
Interest Rate
6.83%
Create a Home Valuation Report for This Property
The Home Valuation Report is an in-depth analysis detailing your home's value as well as a comparison with similar homes in the area
Home Values in the Area
Average Home Value in this Area
Purchase History
| Date | Buyer | Sale Price | Title Company |
|---|---|---|---|
| Myers Amanda L | $118,500 | -- | |
| Elkeurti Omar | $114,500 | -- | |
| Hajek Robert O | $92,500 | -- |
Source: Public Records
Mortgage History
| Date | Status | Borrower | Loan Amount |
|---|---|---|---|
| Open | Myers Amanda L | $119,000 | |
| Previous Owner | Elkeurti Omar | $109,250 | |
| Previous Owner | Hajek Robert O | $83,000 |
Source: Public Records
Tax History Compared to Growth
Tax History
| Year | Tax Paid | Tax Assessment Tax Assessment Total Assessment is a certain percentage of the fair market value that is determined by local assessors to be the total taxable value of land and additions on the property. | Land | Improvement |
|---|---|---|---|---|
| 2025 | $3,230 | $191,000 | $38,200 | $152,800 |
| 2024 | $3,330 | $185,200 | $35,100 | $150,100 |
| 2023 | $3,330 | $180,900 | $35,100 | $145,800 |
| 2022 | $3,052 | $159,200 | $29,000 | $130,200 |
| 2021 | $2,842 | $149,400 | $29,000 | $120,400 |
| 2020 | $2,842 | $133,400 | $26,000 | $107,400 |
| 2019 | $2,726 | $130,100 | $26,000 | $104,100 |
| 2018 | $2,648 | $130,100 | $26,000 | $104,100 |
| 2017 | $2,629 | $128,000 | $26,000 | $102,000 |
| 2016 | $2,629 | $121,500 | $26,000 | $95,500 |
| 2015 | $2,621 | $121,804 | $25,972 | $95,832 |
| 2014 | $2,434 | $126,446 | $25,972 | $100,474 |
| 2013 | $2,404 | $126,446 | $25,972 | $100,474 |
Source: Public Records
Map
Nearby Homes
- 3205 33rd Ave SW
- 3009 Carriage Dr SW
- 3226 Bramble Rd SW
- 3221 Bramble Rd SW
- 3108 Huxley Ln SW
- 3715 33rd Ave Sw #5 8 Ac
- 3715 33rd Ave Sw #4 8 Ac
- 3619 King Dr SW
- 3421 Banar Dr SW Unit B
- 3045 Samuel Ct SW Unit C
- 3045 Samuel Ct SW
- 3737 Monarch Dr SW
- 4030 37th Ave SW Unit D
- 3620 Banar Dr SW Unit E
- 3212 Wilson Ave SW
- 3302 Sokol Ln SW
- 3406 Sokol Ln SW
- 4310 Banar Ave SW
- 3606 Bluebird Dr SW
- 3424 Sokol Ln SW
- 3213 Pebble Dr SW
- 3216 Bayberry Dr SW
- 3209 Pebble Dr SW
- 3212 Bayberry Dr SW
- 3108 Chapel Dr SW
- 3102 Chapel Dr SW
- 3114 Chapel Dr SW
- 3216 Pebble Dr SW
- 3208 Bayberry Dr SW
- 3212 Pebble Dr SW
- 3205 Pebble Dr SW
- 3022 Chapel Dr SW
- 3120 Chapel Dr SW
- 3208 Pebble Dr SW
- 3204 Bayberry Dr SW
- 3016 Chapel Dr SW
- 3201 Pebble Dr SW
- 3204 Pebble Dr SW
- 3219 Carriage Dr SW
- 3200 Bayberry Dr SW