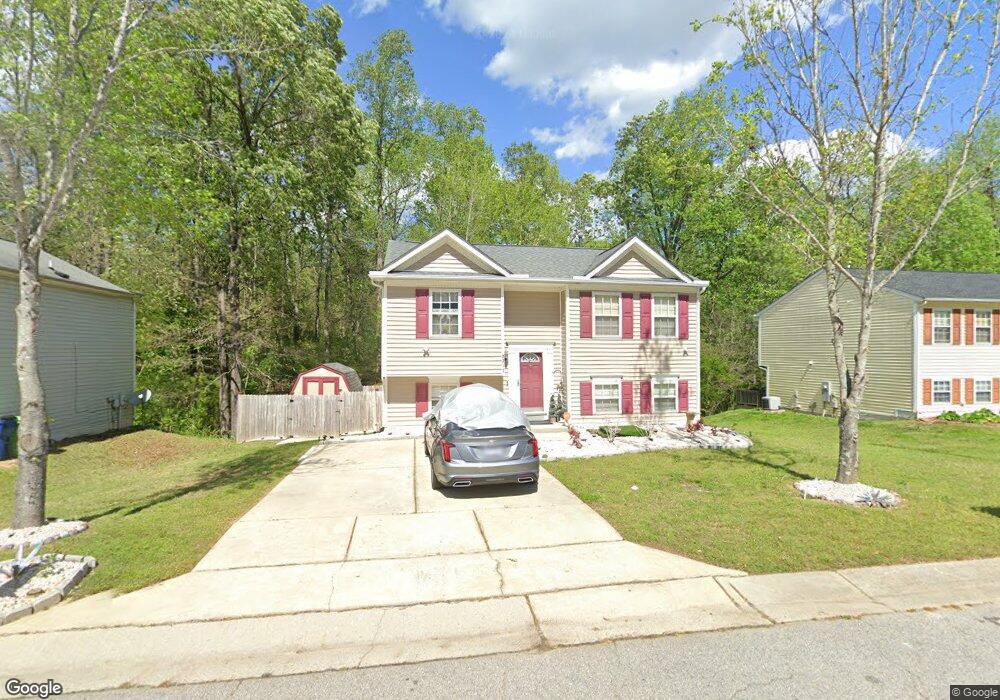
3217 Slippery Elm Dr Raleigh, NC 27610
South Raleigh NeighborhoodEstimated Value: $307,586 - $337,000
3
Beds
2
Baths
1,677
Sq Ft
$192/Sq Ft
Est. Value
About This Home
This home is located at 3217 Slippery Elm Dr, Raleigh, NC 27610 and is currently estimated at $321,397, approximately $191 per square foot. 3217 Slippery Elm Dr is a home located in Wake County with nearby schools including Walnut Creek Elementary School, West Lake Middle, and Southeast Raleigh Magnet High School.
Ownership History
Date
Name
Owned For
Owner Type
Purchase Details
Closed on
Jan 31, 2022
Sold by
Linda Taylor
Bought by
Taylor Linda
Current Estimated Value
Purchase Details
Closed on
Mar 10, 2005
Sold by
Anderson Homes Inc
Bought by
Taylor Lynda
Home Financials for this Owner
Home Financials are based on the most recent Mortgage that was taken out on this home.
Original Mortgage
$103,920
Interest Rate
8.45%
Mortgage Type
Fannie Mae Freddie Mac
Purchase Details
Closed on
Sep 27, 2004
Sold by
Goodwin Grier & Associates Llc
Bought by
Anderson Homes Inc
Home Financials for this Owner
Home Financials are based on the most recent Mortgage that was taken out on this home.
Original Mortgage
$33,289
Interest Rate
5.78%
Mortgage Type
Purchase Money Mortgage
Create a Home Valuation Report for This Property
The Home Valuation Report is an in-depth analysis detailing your home's value as well as a comparison with similar homes in the area
Home Values in the Area
Average Home Value in this Area
Purchase History
| Date | Buyer | Sale Price | Title Company |
|---|---|---|---|
| Taylor Linda | -- | Shoaf Law Firm Pa | |
| Taylor Lynda | $130,000 | -- | |
| Anderson Homes Inc | $24,000 | -- |
Source: Public Records
Mortgage History
| Date | Status | Borrower | Loan Amount |
|---|---|---|---|
| Previous Owner | Taylor Lynda | $103,920 | |
| Previous Owner | Anderson Homes Inc | $33,289 | |
| Previous Owner | Anderson Homes Inc | $24,000 | |
| Closed | Taylor Lynda | $25,980 |
Source: Public Records
Tax History Compared to Growth
Tax History
| Year | Tax Paid | Tax Assessment Tax Assessment Total Assessment is a certain percentage of the fair market value that is determined by local assessors to be the total taxable value of land and additions on the property. | Land | Improvement |
|---|---|---|---|---|
| 2025 | $2,392 | $272,028 | $100,000 | $172,028 |
| 2024 | $2,383 | $272,028 | $100,000 | $172,028 |
| 2023 | $1,760 | $159,610 | $30,000 | $129,610 |
| 2022 | $1,636 | $159,610 | $30,000 | $129,610 |
| 2021 | $1,573 | $159,610 | $30,000 | $129,610 |
| 2020 | $1,545 | $159,610 | $30,000 | $129,610 |
| 2019 | $1,639 | $139,724 | $30,000 | $109,724 |
| 2018 | $1,547 | $139,724 | $30,000 | $109,724 |
| 2017 | $1,474 | $139,724 | $30,000 | $109,724 |
| 2016 | $1,444 | $139,724 | $30,000 | $109,724 |
| 2015 | $1,402 | $133,468 | $34,000 | $99,468 |
| 2014 | $1,330 | $133,468 | $34,000 | $99,468 |
Source: Public Records
Map
Nearby Homes
- 2816 Smoke Place
- 2756 Shepherd Valley St
- 2911 Benevolence Dr
- 2403 Savior St
- 2424 Shepherd Valley St
- 3030 Rock Quarry Rd
- 2908 Basswood Dr
- 3604 Rivermist Dr
- 3445 Dutchman Rd
- 3705 Rivermist Dr
- 2109 Star Sapphire Dr
- 213 Gatewood Dr
- 1725 Fox Hollow Dr
- 206 Plaza Dr
- 308 Plaza Dr
- 123 Alta Crest Ln
- 2704 Hope Diamond Ct
- 2414 Quarry Ridge Ln
- 3513 Diamond Springs Dr
- 3405 Mogollon Ct
- 3221 Slippery Elm Dr
- 3213 Slippery Elm Dr
- 3209 Slippery Elm Dr
- 3225 Slippery Elm Dr
- 3216 Slippery Elm Dr
- 3212 Slippery Elm Dr
- 3220 Slippery Elm Dr
- 3205 Slippery Elm Dr
- 3229 Slippery Elm Dr
- 3208 Slippery Elm Dr
- 2800 Maidenhair Dr
- 3204 Slippery Elm Dr
- 3201 Slippery Elm Dr
- 2804 Maidenhair Dr
- 3233 Slippery Elm Dr
- 3217 Balm Ct
- 3213 Balm Ct
- 3221 Balm Ct
- 3200 Slippery Elm Dr
- 3153 Slippery Elm Dr