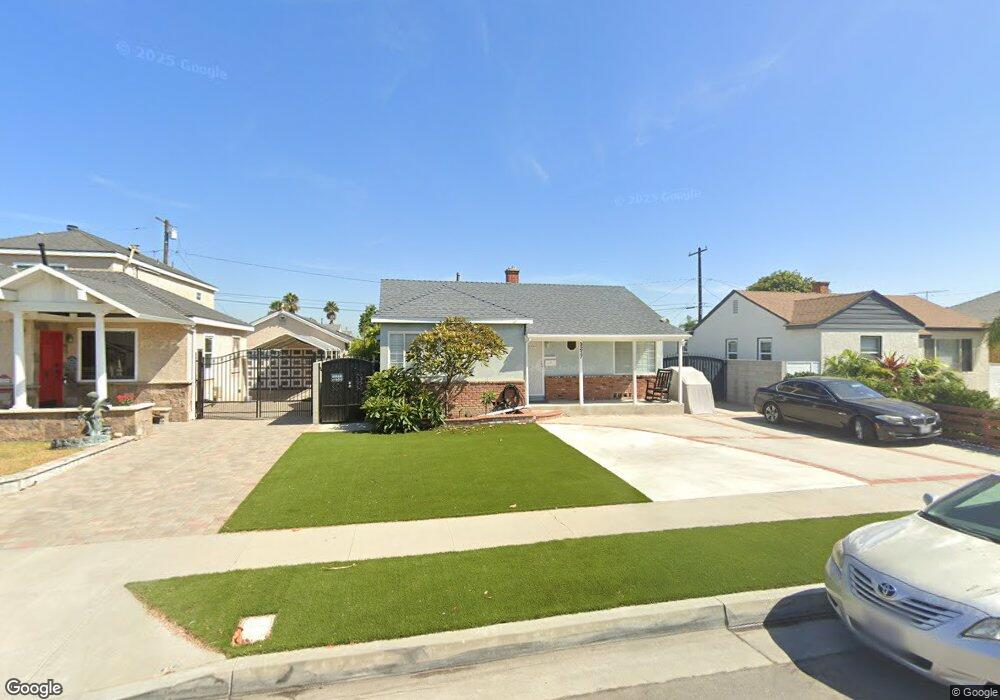
3217 W 153rd St Gardena, CA 90249
El Camino Village NeighborhoodEstimated Value: $800,374 - $870,000
2
Beds
2
Baths
1,240
Sq Ft
$671/Sq Ft
Est. Value
About This Home
This home is located at 3217 W 153rd St, Gardena, CA 90249 and is currently estimated at $832,594, approximately $671 per square foot. 3217 W 153rd St is a home located in Los Angeles County with nearby schools including Mark Twain Elementary School, Will Rogers Middle School, and Leuzinger High School.
Ownership History
Date
Name
Owned For
Owner Type
Purchase Details
Closed on
Jul 14, 2016
Sold by
Nguyen Sam Hung
Bought by
Nguyen Hao and Nguyen Sam Hung
Current Estimated Value
Purchase Details
Closed on
Aug 28, 2013
Sold by
Nguyen Sam
Bought by
Nguyen Sam
Home Financials for this Owner
Home Financials are based on the most recent Mortgage that was taken out on this home.
Original Mortgage
$150,000
Outstanding Balance
$118,619
Interest Rate
6%
Mortgage Type
New Conventional
Estimated Equity
$713,975
Purchase Details
Closed on
May 14, 2002
Sold by
Nguyen Sam
Bought by
Nguyen Sam
Home Financials for this Owner
Home Financials are based on the most recent Mortgage that was taken out on this home.
Original Mortgage
$209,600
Interest Rate
7.18%
Purchase Details
Closed on
Apr 9, 2002
Sold by
Kobayashi Yoshio and Kobayashi Natsue Habu
Bought by
Nguyen Sam
Home Financials for this Owner
Home Financials are based on the most recent Mortgage that was taken out on this home.
Original Mortgage
$209,600
Interest Rate
7.18%
Create a Home Valuation Report for This Property
The Home Valuation Report is an in-depth analysis detailing your home's value as well as a comparison with similar homes in the area
Home Values in the Area
Average Home Value in this Area
Purchase History
| Date | Buyer | Sale Price | Title Company |
|---|---|---|---|
| Nguyen Hao | -- | Wfg National Title Company | |
| Nguyen Sam | -- | Fidelity National Title Oran | |
| Nguyen Sam | -- | -- | |
| Nguyen Sam | $598,636 | First American Title Co |
Source: Public Records
Mortgage History
| Date | Status | Borrower | Loan Amount |
|---|---|---|---|
| Open | Nguyen Sam | $150,000 | |
| Closed | Nguyen Sam | $209,600 |
Source: Public Records
Tax History Compared to Growth
Tax History
| Year | Tax Paid | Tax Assessment Tax Assessment Total Assessment is a certain percentage of the fair market value that is determined by local assessors to be the total taxable value of land and additions on the property. | Land | Improvement |
|---|---|---|---|---|
| 2025 | $5,636 | $418,585 | $318,939 | $99,646 |
| 2024 | $5,636 | $410,379 | $312,686 | $97,693 |
| 2023 | $5,348 | $402,333 | $306,555 | $95,778 |
| 2022 | $5,347 | $394,445 | $300,545 | $93,900 |
| 2021 | $5,212 | $386,711 | $294,652 | $92,059 |
| 2019 | $5,024 | $375,243 | $285,913 | $89,330 |
| 2018 | $4,872 | $367,886 | $280,307 | $87,579 |
| 2016 | $4,529 | $353,602 | $269,423 | $84,179 |
| 2015 | $4,412 | $348,292 | $265,377 | $82,915 |
| 2014 | $4,385 | $341,470 | $260,179 | $81,291 |
Source: Public Records
Map
Nearby Homes
- 15522 Faysmith Ave
- 3245 Marine Ave
- 15309 Patronella Ave
- 3129 Marine Ave Unit 7
- 3351 Marine Ave
- 15200 Atkinson Ave
- 14815 Crenshaw Blvd
- 15132 Kornblum Ave
- 14835 Wadkins Ave
- 3719 W 154th St
- 14751 Wadkins Ave
- 15302 Doty Ave
- 14526 Chadron Ave
- 2612 Manhattan Beach Blvd
- 2817 W 146th St
- 14540 Yukon Ave
- 16028 Arcturus Ave
- 14405 Cerise Ave Unit 35
- 14324 Chadron Ave
- 14623 Roxton Ave
- 3213 W 153rd St
- 3223 W 153rd St
- 3209 W 153rd St
- 3229 W 153rd St
- 3218 W 152nd Place
- 3222 W 152nd Place
- 3212 W 152nd Place
- 3203 W 153rd St
- 3233 W 153rd St
- 3228 W 152nd Place
- 3208 W 152nd Place
- 3218 W 153rd St
- 3212 W 153rd St
- 3222 W 153rd St
- 3232 W 152nd Place
- 3202 W 152nd Place
- 3208 W 153rd St
- 3228 W 153rd St
- 3169 W 153rd St
- 3239 W 153rd St